For B2B marketing teams, the monthly LinkedIn report has become a ritual. Impressions climbed, follower growth ticked up, and engagement rate stayed flat. Then the CEO asks whether any of that produced a meeting, and nobody in the room has an answer.
A LinkedIn report has one job: make the next decision obvious. If it doesn't change what the team does next month, it was a screenshot with better styling.
This covers marketing performance reporting on LinkedIn, not reporting abusive content or policy violations. It's written for marketing leads, agency account managers, and the social managers who build the reports someone else presents.
TLDR:
- Report on a 28 to 42 day window. Weekly LinkedIn data is mostly variance from one or two posts.
- Pick 3-4 outcome categories (awareness, consideration, pipeline) instead of exporting every metric available.
- Personal profile reporting needs its own template, because Company Page metrics don't transfer.
- Lead with the headline finding and the recommended action. Charts belong in the appendix.
- The most valuable layer of a LinkedIn report is the named list of people and accounts who engaged, matched against your CRM.
What Is LinkedIn Reporting?
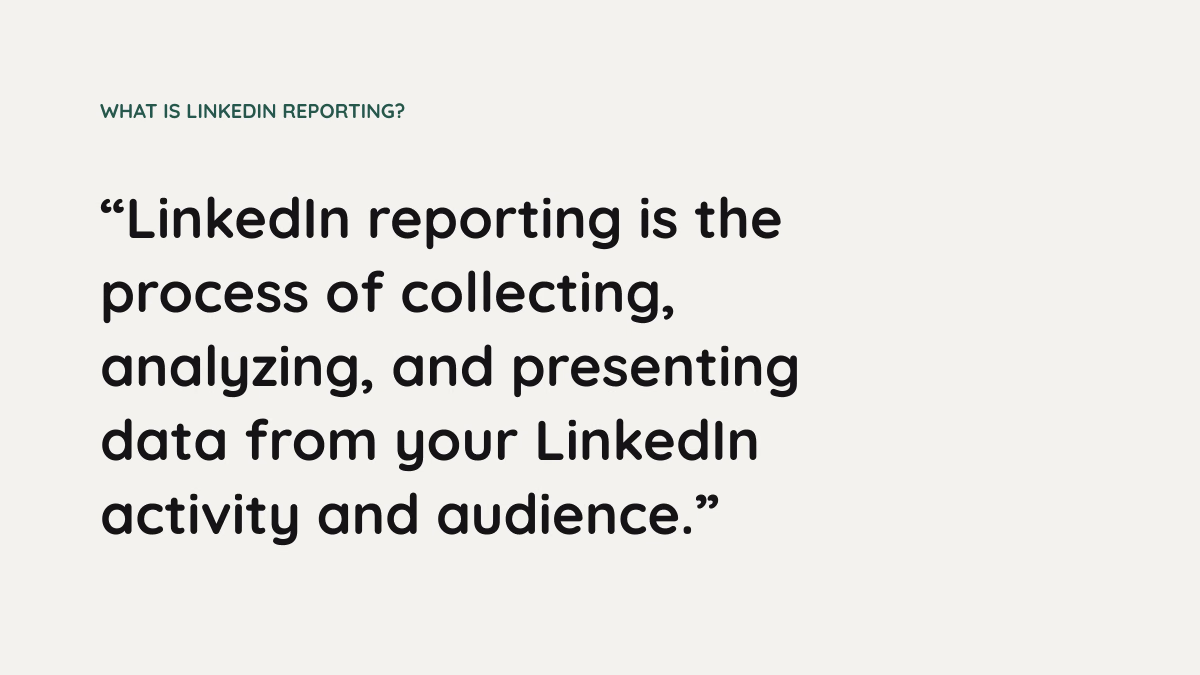
LinkedIn reporting is the practice of collecting LinkedIn performance data across a defined time window, selecting the subset of metrics tied to a stated business goal, and presenting it with a recommendation attached. Analytics is the raw data LinkedIn hands you, a dashboard is the display layer, and a report is an argument about what to do next.
Dashboards don't make decisions, and Company Pages vs personal profiles need separate templates, since they behave differently enough that one can't serve both.
How to Approach LinkedIn Reporting
Step 1: Decide Who the Report Is For Before You Pull a Single Number
The same LinkedIn data produces three different reports depending on who reads it. Get this wrong and everything downstream is wasted work.
- Identify the decision the reader is making. Renew the budget? Shift the content mix? Approve a headcount?
- Match the metric layer to that decision, so an exec sees pipeline influence and cost avoided while a social manager sees post-level diagnostics.
- Set the length before you build anything. Exec gets one slide, the team gets the full breakdown.
- Write the headline finding first, on a blank page, before a single chart exists. If you can't write that sentence, you don't have a report yet.
A CMO doesn't need to know that carousels beat text posts. They need to know that shifting a meaningful share of the calendar to carousels adds reach at zero incremental spend, and that you'd like permission to do it.
Step 2: Choose 3-4 Metric Categories (Not 30)
Exporting every available metric is a hedge against not knowing what you're measuring. It reads as thorough and functions as noise. It's also the most common failure in agency client reporting, because volume feels like value when you're three weeks from a renewal conversation.
Sociality.io's 2025 analytics framework gives a usable spine: awareness (impressions, reach), consideration (click-through rate, watch time), and pipeline (lead form performance, profile views tied to intent). Three categories, four or five metrics total.
Now look at what the platform itself recommends. LinkedIn's 2025 guidance points marketers at four things: direct traffic growth, traffic sources, non-branded keyword search, and referrals. Follower count isn't on the list. Neither is engagement rate.
"But my CEO asks about followers," you say. Fine.
Include follower growth as context, never as the headline. It's a lagging indicator of everything else you're already measuring. For a deeper cut on selection, our post on key LinkedIn metrics works through each one.
Here's what gets lost when you skip category selection. 400 engagements from the wrong people is worse than 40 from the right ones, because the first number will keep a bad strategy funded for another two quarters.
"If you're only getting likes from your own employees, that's not necessarily a LinkedIn problem. That's a strategy problem." — Jeffrey Zhao
Step 3: Set the Reporting Window (Weekly Is Almost Always Wrong)
Report on a 28 to 42 day window. Sociality.io's 2025 guidance on LinkedIn reporting windows recommends exactly that range, because LinkedIn performance unfolds slowly and shorter windows miss slow-burn posts that pick up traction over two or three weeks. Socialinsider's 2025 analysis of monthly vs weekly trends lands in the same place, adding that quarterly comparisons are the better lens for judging strategic shifts.
The small-sample problem is easier to see with arithmetic than with argument. A Company Page publishes 8 posts in a month and averages 1,200 impressions per post, so 9,600 total. One post lands at 6,400 impressions on its own. Strip it out and the remaining seven average 457. Report the week containing that outlier and engagement is "up 180%." Report the full 42-day window and the median post is roughly flat. Only one of those numbers is a decision you'd want to act on.
Keep the window fixed across reports. Changing it between cycles is how cherry-picking happens, usually by accident and always at the exact moment the numbers dipped.
Step 4: Structure the Report Around the Finding rather than Data
Use the same five-part shape every time. It survives translation into a Slides deck, a Notion doc, a Slack summary, or a client email.
- Headline finding: One sentence, plain language, with a number in it.
- What you recommend doing about it, in one to three sentences.
- The evidence: three or four charts maximum, each with a one-line caption saying what it shows.
- What you're testing next period.
- Appendix with everything else, for anyone who wants to check the work.
Any chart that doesn't support the headline finding or the recommendation gets moved to the appendix, not deleted. You keep the data; you just stop making people scroll past it.
Bad headline: "October Performance Summary."
Good headline: "Founder posts drove 4x the profile views of Company Page posts at zero incremental spend, so we recommend shifting two Company Page slots per week to executive accounts."
Step 5: Connect LinkedIn Activity to Pipeline
Full multi-touch attribution for LinkedIn organic usually isn't achievable. Chasing it is how reporting projects quietly die around month four. What is achievable, and sufficient, is directional evidence plus a proxy value plus a named list.
UTM-tagged clicks into CRM catch the minority of buyers who click through. That's real data on an incomplete population. Self-reported attribution on the demo form ("how did you hear about us?") is consistently undervalued and often the most honest signal available on a nine-month cycle.
And then there's the layer most teams skip: engagement-to-account matching.
The Layer Worth Building: Who Engaged, by Name
Engagement rate doesn't belong on page one of a LinkedIn report. The headline should be a named list of the companies and people who engaged, matched against your CRM.
An aggregate rate is un-auditable. Only page admins can pull it, and a client receiving one from an agency has no way to verify it. It's also un-comparable over time, because LinkedIn's native export caps Company Page history at roughly 365 days and personal profiles at less.
So the standard LinkedIn report is a rate the client can't verify, on a baseline you'll lose next year, describing an audience you can't name.
The capture is simple in principle.
For every post, record who liked and commented, with name, company, title, and seniority. Hold that list somewhere you own (a spreadsheet, a warehouse table, your CRM) and specifically not somewhere LinkedIn expires. Then match company names against CRM accounts and flag anything with an open opportunity.
What that produces is a sentence no impressions chart can produce. A handful of people from several target accounts engaged this period, a few of those accounts had open opportunities worth a substantial combined value, and a couple had gone quiet in sales outreach.
That's a report a CRO reads. It's also the thing that survives a retainer renewal, because connecting social data to CRM is the difference between "we posted 34 times" and "here are the buyers we reached."
Be honest about the limits. Titles are self-reported and often stale. Plenty of engagers never convert. Some of your best-fit engagers are researchers, competitors, or job seekers. Company name matching is fuzzy, so budget for manual cleanup. Present it as influence, not credit. Anyone who claims the post closed the deal loses the room.
Earned Media Value as the Finance-Legible Proxy
Earned media value is what your organic impressions would have cost to buy as LinkedIn ads. Divide total impressions by 1,000 and multiply by your channel CPM. Worked example: 240,000 organic impressions across a 42-day window, at a $60 LinkedIn CPM, gives 240,000 ÷ 1,000 × $60 = $14,400. Substitute your own CPM. It's a proxy rather than revenue, but it's a number a finance team can weigh against the cost of running the program.
Reporting on Personal Profiles and Executive Content
Company Page reporting templates don't transfer to personal profiles. Pretending otherwise is the fastest-growing reporting gap in B2B right now, particularly as personal profiles outperform company pages in feed distribution.
Three differences change the template. Personal profile analytics are thinner than Company Page data and the export windows are shorter, which the mechanics of how to export LinkedIn analytics cover in detail. Profile views are a genuine conversion metric on a personal account and close to useless on a Company Page. And reach on a personal profile scales with connection count, so absolute impressions aren't comparable between a founder with a large network and a VP with a much smaller one. Report per-post medians and growth deltas instead.
What belongs in an executive report: post-level median engagement rate, profile views, connection request volume and quality, inbound DMs, and the named ICP engagement list from Step 5. That last one is the entire point of running executive content.
Across the customer accounts we see, the multi-account pull is where these programs die. Reporting on eight executives means eight data pulls, eight permission checks, and eight exports that expire on different schedules. Month three arrives and someone quietly stops doing it.
Four LinkedIn Reporting Mistakes That Undermine Credibility
- Moving the goalposts on the date range: Comparing a 30-day window to a 45-day window because it looks better is the fastest way to permanently lose a stakeholder's trust. They will notice.
- Reporting rates on tiny denominators: A 400-follower page presenting engagement rate swings is presenting variance with a percent sign on it.
- Treating impressions as the headline: Impressions are an input. Nobody has ever bought B2B software because they saw something.
- Attaching no recommendation: Socialinsider's 2025 reporting guidance is blunt that a strong report ends with specific next actions. A report that only describes what happened is a status update wearing a chart.
How Ordinal Handles LinkedIn Reporting
Ordinal's analytics refresh daily across every connected account, so reporting on eight executives is one view rather than eight manual exports. Label-based analytics break performance down by content category, which is what makes a recommendation to shift more of the calendar toward a format defensible rather than a hunch. Earned media value is calculated in-platform against a CPM you set per channel.
And on the layer this piece cares most about: leads data (Enterprise) shows which individual LinkedIn users liked or commented on your posts, which is the account-matching input from Step 5 without the manual capture.
Ordinal's LinkedIn analytics covers the rest.
Final Thoughts
Before the next reporting cycle, open a blank page and write the headline finding sentence with a made-up number in it. Not the data you have. The sentence you'd want to be able to say. If you can't articulate what that sentence should claim, the problem is the strategy rather than the reporting, and no dashboard is going to fix it.
Then do three things. Set the window to 42 days and leave it there. Pick three metric categories and delete the rest from the template. And start capturing the names, because the named list of engaged accounts is the only part of a LinkedIn report that gets more valuable the longer you keep it.
Everything else expires the moment LinkedIn's export window rolls over.
Frequently Asked Questions
How Often Should You Report on LinkedIn Performance?
Monthly, using a 28 to 42 day window, works best for most B2B teams. Weekly LinkedIn data gets dominated by noise from a single post, and Socialinsider's 2025 analysis found monthly trends carry more meaning than weekly swings.
What Metrics Should Be in a LinkedIn Report?
Stick to three or four outcome categories: awareness (impressions, reach), consideration (click-through rate, video watch time), and pipeline (lead form performance, profile views from target accounts). LinkedIn's own 2025 guidance points marketers toward direct traffic growth, traffic sources, non-branded search, and referrals, with follower count nowhere on the list.
How Do You Report on LinkedIn Personal Profiles Instead of Company Pages?
Use a separate template entirely, because personal profile analytics come with shorter export windows and thinner data, and profile views function as a conversion signal in a way they don't on pages. Report per-post median engagement and growth deltas rather than raw totals, since reach scales with connection count and isn't comparable across two executives.
How Do You Prove LinkedIn ROI When the Sales Cycle Is Nine Months Long?
Report leading indicators now and reconcile revenue once a year. Track ICP engagement, target-account profile views, and self-reported attribution on demo forms as near-term proxies, then run a full pipeline check annually once deals have had time to close.
What's the Difference Between LinkedIn Analytics and LinkedIn Reporting?
Analytics is the raw data LinkedIn hands you. A report is a selected slice of that data, framed around a business question, with a recommendation attached, and only the report is built to change what someone does next.
Do You Need a Third-Party Tool for LinkedIn Reporting?
Not if you're managing a single Company Page, where native analytics plus a spreadsheet handles it fine. Third-party tools earn their keep once you're reporting across multiple accounts, especially personal profiles, where export limits turn a monthly report into eight separate manual pulls.
What Is Earned Media Value on LinkedIn and How Do You Calculate It?
Earned media value estimates what your organic impressions would have cost as paid ads. Divide total impressions by 1,000 and multiply by your channel CPM: at a $60 CPM, 240,000 organic impressions carry an EMV of $14,400.
What Should a LinkedIn Report Include for an Executive Audience?
One slide. The headline finding in plain language with a number attached, the recommended action, and no more than three supporting charts, with everything else in an appendix for anyone who wants to check the work.
Related Posts
Looking to learn more? The below posts may be helpful for you to learn more about social media and content marketing.