
Introduction
Have you ever walked into a budget meeting armed with impressive LinkedIn analytics like “follower count” and “total impressions,” only for your executives to counter with: “That’s great, but what’s our ROI?”
Here’s a fact. LinkedIn absolutely works for B2B. According to LinkedIn, the platform drives over 80% of B2B social media leads. So, if it does work, why do some marketers still fail when it comes to generating revenue? Unfortunately, most B2B marketers track the wrong metrics. Most teams measure popularity when they should be measuring the pipeline.
When it comes to LinkedIn success, the true measure is how effectively your LinkedIn content attracts, engages, and converts your ideal audience - your Ideal Customer Profile (ICP).
In this guide, we talk about the 5 Key LinkedIn metrics for B2B marketers in 2025 that actually tie to business goals. Let’s dive in!
Why LinkedIn Metrics Matter for B2B Marketers
LinkedIn isn’t just a branding channel - it’s a B2B growth engine. The challenge here is to prove that your social content drives real business results, not just reach. That’s where LinkedIn analytics for B2B becomes essential - helping teams connect content performance with real revenue impact.
When you track the right social media ROI metrics, you:
- Identify what works (and what doesn’t)
- Understand which content themes resonates with your target decision-makers
- Align your LinkedIn strategy with business goals like pipeline and conversions
Basically, when you track the right metrics, you replicate success instead of guessing
This is particularly important, as in 2025, the focus for B2B marketers shifted from the volume of engagement to the quality of engagement. So, metrics like ICP Engagements that track interactions from your target audience are now becoming the clearest indicators of ROI.
The problem with LinkedIn’s native analytics is that it only tells you part of the story. You get impressions, clicks, and interactions, but not who’s engaging or if those who engage match your target buyer profile.
This is where Ordinal steps in to help B2B teams. Our platform goes beyond surface-level metrics by showing you who is engaging, not just how many.
5 Key Metrics B2B Marketers Should Track
It’s important to remember that not all LinkedIn metrics are created equal. Some show you how content performs, while others show you whether it’s driving business outcomes. Here are the 5 metrics that matter for B2B marketers and how to use them to improve your LinkedIn strategy.
1. Engagement Rate (Likes, Comments, Shares, Clicks)
What it measures: How compelling your content is in relation to how many people see it
Numbers look impressive in reports, but without context, they’re meaningless. LinkedIn Engagement rate is calculated by dividing the total engagement (likes, comments, shares, and clicks) by impressions. This indicated content resonance - whether your posts connect with people enough to spark interaction.
Formula: Engagement Rate = (Total Engagements ÷ Total Impressions) × 100
For example, a post with 500 likes and 50,000 impressions (1% engagement rate) is underperforming compared to one with 100 likes and 2,000 impressions (5% engagement rate).
Benchmark: According to recent LinkedIn benchmark data, the average engagement rate by impressions is 3.85%-5.20%. Anything above 5% indicates highly resonant content that's worth replicating.
👉 Why it matters for business outcomes: High engagement rates signal that your content is hitting the right nerve with your audience. When LinkedIn sees this, the platform’s algorithm rewards that engagement by showing your content to more people.
How to improve your engagement rate:
- Focus on conversion-driven posts that invite responses.
- Ask questions. Encourage comments.
- Challenge common beliefs.
- Create Multi-Image posts (Average engagement rate of 5.50%)
- Use consistent posting times to stay visible.
✅ Pro Tip: Combine engagement rate with impressions to calculate “engagement per impression.” This gives you a truer view of content performance over time.
2. Click Through Rate:
What it measures: How many people who see your post are compelled to click your link or learn more
Click Through Rate (CTR) tells you how effectively your posts drive people to take the next step to either reading a blog, watching a video, or visiting your site or landing page.
Formula: CTR = (Total Clicks ÷ Total Impressions) × 100
How to track it: To track this, use UTM parameters on every link you share. That way, you can trace LinkedIn traffic in Google Analytics or your marketing platform. This gives you more insights into which specific posts drive conversions.
Benchmark: Organic CTRs are between 0.5 - 2% for B2B content. Anything above 2% would mean a strong message-market fit and a strong call to action (CTA). When it comes to paid LinkedIn ads, the benchmark ranges from 0.44%-0.65% which varies based on targeting and industry.
👉 Why it matters for business outcomes: Clicks represent intent. If someone takes the next step, it means they show genuine interest. CTR is the bridge that connects LinkedIn activity and website traffic, so that makes it a key metric for tracking how social efforts contribute to your funnel.
How to Improve LinkedIn CTRs:
- Test different link placements (first comment vs in post)
- Keep links above “See more” fold.
- Use clear CTAs (”Read More,” “Join Us,” “See full insights”)
- Visual heirarchy (Use line breaks and emojis to make CTAs stand out
- Optimize your headlines (this can make or break clicks)
✅ Pro Tip: Test posting your link in the first comment instead of in the body to maintain reach while driving clicks.
3. Follower Growth Rate (Quality over Quantity)
What it measures: How quickly you’re building your audience and if that audience is relevant.
Follower Count is a classic vanity metric. It often gets mistaken for success. Follower Growth Rate, on the other hand, tells a different story. It measures the speed and efficiency of your growth over time. What matters for B2B marketers is the rate at which our audience is growing and whether or not those followers align with your Ideal Customer Profile (ICP).
Formula: Follower Growth Rate = (New Followers ÷ Total Followers at Start of Period) × 100
For example, you gained 500 new followers from a starting base of 5,000:
→ (500 ÷ 5,000) × 100 = 10% Follower Growth Rate
How to track it: To track follower quality, analyze their job titles, industries, and company sizes of recent followers. Doing this will let you know if they align with your Ideal Customer Profile. For example, if you are a SaaS tool for marketing teams, but your followers are mostly job seekers or students, then you are building the wrong audience.
Benchmark: According to Rival IQ’s 2024 LinkedIn Benchmark report, brands are growing their followers at least 1% monthly. Accounts under 5k followers average a monthly growth of 1.5% while accounts over 100k followers grow around 1.2% a month.
👉 Why it matters for B2B teams: Follower Growth Rate shows efficiency over vanity. This normalizes dates, making it easier to compare results. It also signals brand momentum and links directly to ICP quality. A surge in followers only matters if they’re from your ideal audience. To measure how relevant your growth really is, combine this metric with ICP Engagements.
How to Improve Follower Growth Rate:
- Post consistently (3-5 times per week minimum)
- Engage authentically in comments on others’ posts
- Create content that positions you as a credible voice
✅ Pro Tip: Don’t celebrate follower spikes alone — measure how many of those followers actually match your ICP.
4. Impressions and Reach
What it measures: How visible your content is, how many people are seeing your posts, and how often they see it
Impressions track the total number of times your content is displayed, while LinkedIn Post Reach tracks the unique number of people who saw it.
👉 Why it matters for business outcomes: Impressions and Reach are the top-of-funnel metrics that are useful when measuring awareness and posting consistency. They don’t directly drive conversions by they are important when it comes to building awareness and keeping your brand top-of-mind.
✅ How to use these metrics strategically: Impressions alone can be misleading. This is why you should combine them with engagement rate so you see how effectively your reach converts into interaction.
For example, two posts each get 5,000 impressions.
- Post A: 50 engagements (1% engagement rate)
- Post B: 200 engagements (4% engagement rate)
Even though both reached the same number of people, Post B performed 4x better.
Benchmark your consistency: Track your average weekly or monthly impressions. Declining impressions often signal algorithm penalties. This is usually caused by low engagement, not posting frequently, or content that violates LinkedIn rules.
How to improve Impressions and Reach:
- Stay active and post consistently
- Post at optimal times when our audience is active (LinkedIn peach hours: 9-11 AM Local Time)
- Use 2-3 niche-relavant hashtags
- Encourage reposts from your team or executives
The key here is that Impressions get your foot in the door. Engagement and clicks close the deal.
5. ICP Engagements (Ideal Customer Profile Interactions) - The most Critical Metric for B2B SaaS
What it measures: Engagement specifically from your Ideal Customer Profile or people who actually matter for your business
This is where real LinkedIn ROI starts to grow. ICP Engagements measure who is engaging with your posts - specifically, whether or not they match our Ideal Customer Profile or not. These people are most likely to buy or influence your product.
How to calculate ICP engagement metrics: Start by tracking who's engaging with your content—names, companies, and job titles. Then, identify which engagements come from your ICP.
Here's an example:
- Your post gets 100 total engagements (likes, comments, shares)
- You identify that 25 of those engagements came from people who match your ICP
- That's a 25% ICP engagement rate
But it gets more powerful. You can use that ratio to estimate ICP-weighted versions of all your other metrics:
- If your post got 2,000 total impressions and 25% of engaged users were ICP, you can estimate ~500 ICP impressions (2,000 × 25%)
- Apply this same logic to calculate ICP click-through rate, ICP engagement rate, and more
This gives you a clearer picture of whether your content is reaching and resonating with the people who actually drive revenue.
👉 Why it matters for business outcomes: Out of these 5 key metrics, ICP engagement is the strongest predictor of revenue and pipeline impact. When you find out who your ICP is and find out whether they like, comment on, or share your content, you now identify warm leads!
✅ How to Implement ICP Engagement Tracking: When you track this manually, it becomes time-consuming. With the right tool, you can easily streamline this.
With Ordinal, you can export a list of everyone who engaged with your posts, pipe that data to Clay.com to filter for ICP matches based on job title, company size, industry, and then calculate the new ICP metrics!
Once you have this workflow set up, you can automatically calculate:
- ICP engagement rate: What percentage of your engaged audience matches your buyer profile?
- ICP CTR: Are your target buyers clicking through to your website?
- ICP conversion rate: Which posts drive the most ICP engagement that eventually converts to pipeline?
Why this changes everything: With ICP Engagement, you stop working for vanity metrics. Instead, you now focus and start optimizing for business outcomes. You can easily identify what works when it comes to content themes, formats, and messaging, and double down on those.
So now, instead of chasing viral content and getting likes from irrelevant audiences, you focus on LinkedIn audience quality and creating content that converts the people who matter most.
How to Use LinkedIn Analytics to Prove LinkedIn ROI
Metrics don’t just describe what happened; they drive decisions.
Here’s how to use your LinkedIn data to prove impact:
- Export post data weekly or monthly to identify patterns.
- Cross-reference engagement data with CRM outcomes.
- Prioritize posts that had both high engagement and strong ICP engagement.
- Use Ordinal’s analytics dashboard to visualize ICP insights automatically — no manual matching required.
✅ Pro Tip: Ordinal’s analytics give you a full breakdown of who engaged — including job titles, companies, and locations — so you can link performance directly to business relevance.
Common Mistakes when Tracking LinkedIn Metrics
In tracking LinkedIn metrics, any experienced marketer can fall into these traps. Here are some of the LinkedIn analytics mistakes to avoid.
- Focusing on vanity metrics (likes, followers). A viral post with thousands of likes from random people won’t have an impact if none of them are potential buyers
- Tracking engagement but not audience quality. Audience quality matters more that quantity. Tracks who’s engaging, not just how many people engaged.
- Tracking metrics inconsistently. Sporadic check-ins won’t work. Establish a weekly or monthly review of LinkedIn analytics to stop patterns and identify what works and what doesn’t.
- Not tying metrics back to pipeline or business outcomes. LinkedIn analytics should connect directly to your marketing goals. Engagement should lead to website traffic and then revenue.
- Optimizing for algorithm vs audience. It’s goo to understand LinkedIn’s algorithm but chasing that at the expense of creating genuine content for your audience will backfire.
Bringing it All Together With Ordinal
Tracking LinkedIn metrics takes a lot of work and can involve juggling multiple LinkedIn analytics tools, B2B social dashboards, exporting CSV files, and complicated spreadsheets. The best B2B teams centralize their LinkedIn analytics in one platform - that’s where Ordinal comes in!
Ordinal takes the guesswork out of measuring success on LinkedIn. Here’s what makes it ideal for B2B teams:
- Centralized Workflow. Instead of switching between multiple tools like LinkedIn analytics, Google Sheets and Slack everything happens in one place. Teams stay aligned, approvals are faster, and you maintain consistent LinkedIn presence without the chaos.
- Multi-Profile Management. Track the performance across founder’s profile, executive team accounts and company page in one dashboard.
- AI-powered analytics summaries. Ordinal's AI can analyze your performance data and surface actionable insights and recommend what to post next.
- Real time ICP engagement visibility. This is where Ordinal really shines. Instead of just seeing “127 people liked your post,” you see their names, companies, and job titles and identify which posts resonate with decision makers in target accounts.
- Full post performance dashboard. Check impressions, engagement rate, CTR and follower growth across all your LInkedIn accounts in one unified view.
With Ordinal, you stop wasting time on guessing and start showing real, measurable ROI for your LinkedIn efforts.
Conclusion
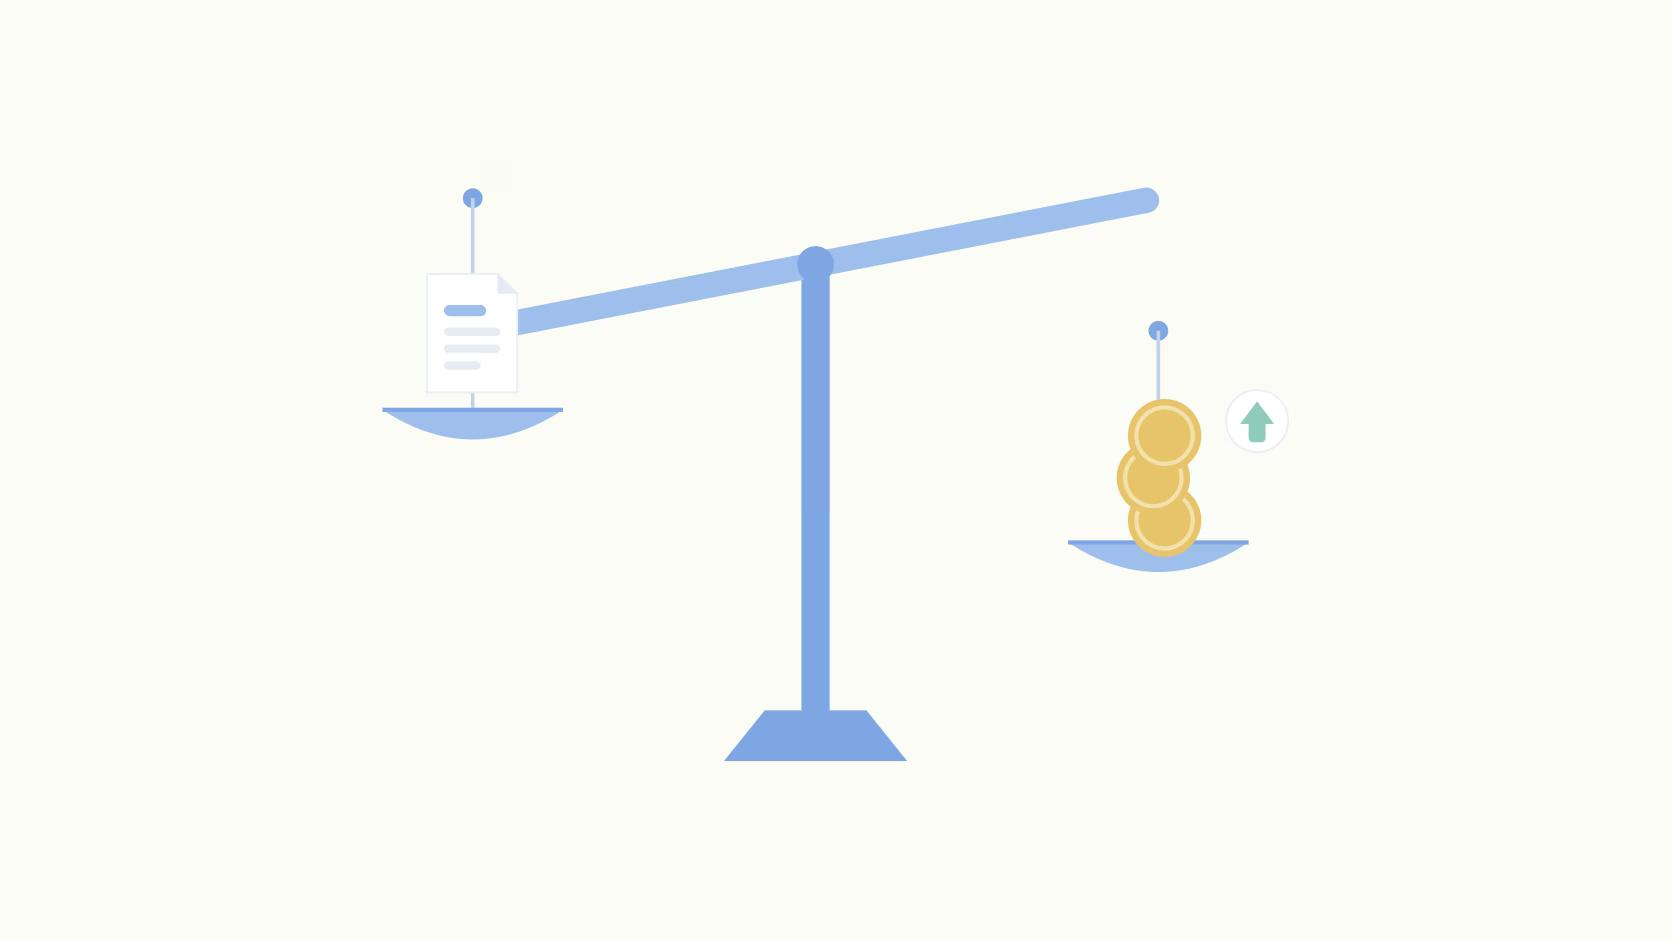
Measuring LinkedIn success isn’t about likes. It’s about understanding what drives results.
For B2B marketers, this means combining LinkedIn analytics with business goals. The key metrics that matter - engagement rate, click through rate, follower growth rate, impressions and reach, and ICP engagements - tell you whether or not your LinkedIn strategy is working or just creating noise.
The right LinkedIn analytics tools turn metrics into strategy. Use Ordinal to make LinkedIn ROI tracking simpler and faster, and transform your content channel into a revenue driver.
Related Posts
Looking to learn more? The below posts may be helpful for you to learn more about social media and content marketing.