
Most LinkedIn users check their analytics in the platform and call it a day, but if you're serious about understanding what content works and why, you need to export analytics from LinkedIn regularly. Once you have that data in a spreadsheet, you can run analyses that LinkedIn's dashboard simply doesn't support, like tracking engagement trends over custom date ranges, comparing campaign performance across quarters, or identifying which post formats consistently drive the best results. With LinkedIn generating $17.81 billion in fiscal year 2025, a 9% increase year over year, understanding your analytics on this growing platform is more valuable than ever. Whether you're managing a Company Page or tracking your personal profile, the export process is straightforward once you know where to look.
In this guide, we'll show you exactly how to pull the data you need and introduce a more streamlined, powerful way to do it using Ordinal.
TLDR:
- LinkedIn lets you export Company Page analytics (visitors, content, followers) as XLS files directly from your dashboard
- Personal profile exports require manual work for each post since LinkedIn lacks bulk export options
- Native exports have limits: manual CSV downloads, restricted date ranges, and single-account access bottlenecks
- Using a tool like Ordinal can automate this entire process without needing admin credentials for each page
Understanding LinkedIn Analytics Before You Export
LinkedIn offers two distinct types of analytics, and knowing the difference between them will save you time when you're ready to export your data.
Company Page Analytics
Company Page analytics give you a complete view of your business presence on LinkedIn. When you access your Company Page analytics dashboard, you'll find five main sections (with additional sections available based on your subscription tier). The Visitors tab shows you demographics about who's viewing your page, including job functions, seniority levels, and company sizes. Content analytics track how your posts are performing with metrics like impressions, engagement rates, and click-through rates. The Followers section breaks down your audience growth over time and follower demographics. You can also monitor Competitors to see how your page stacks up, and the Leads tab (available on some plans) tracks how LinkedIn is driving conversions.
Personal Profile Analytics
Personal profile analytics work differently. LinkedIn gives you basic insights about who's viewed your profile, search appearances, and post performance. You can see how many people discovered your profile through LinkedIn search and which posts generated the most engagement. Personal profiles also show you connection growth trends and how your network is expanding.
The key difference is scope. Company Page data focuses on brand-level metrics across your organization's content and audience. Personal profile data centers on individual visibility and engagement within your professional network. When you export data from either source, you'll get different file structures and metrics based on which type of analytics you're pulling from.
Now let's walk through the specific export process for each analytics type.
How to Export Company Page Analytics From LinkedIn
To export data from your LinkedIn Company Page, you'll need admin access to the page you want to pull analytics from.
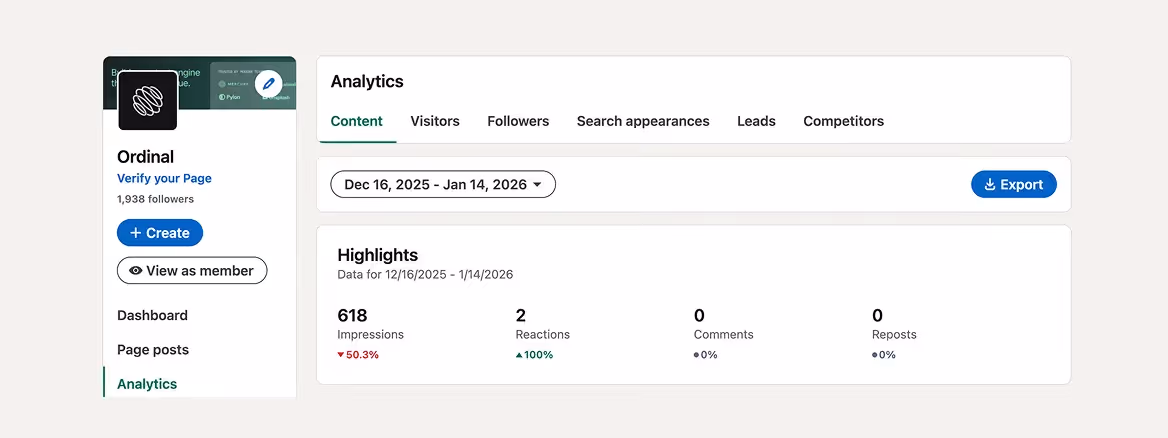
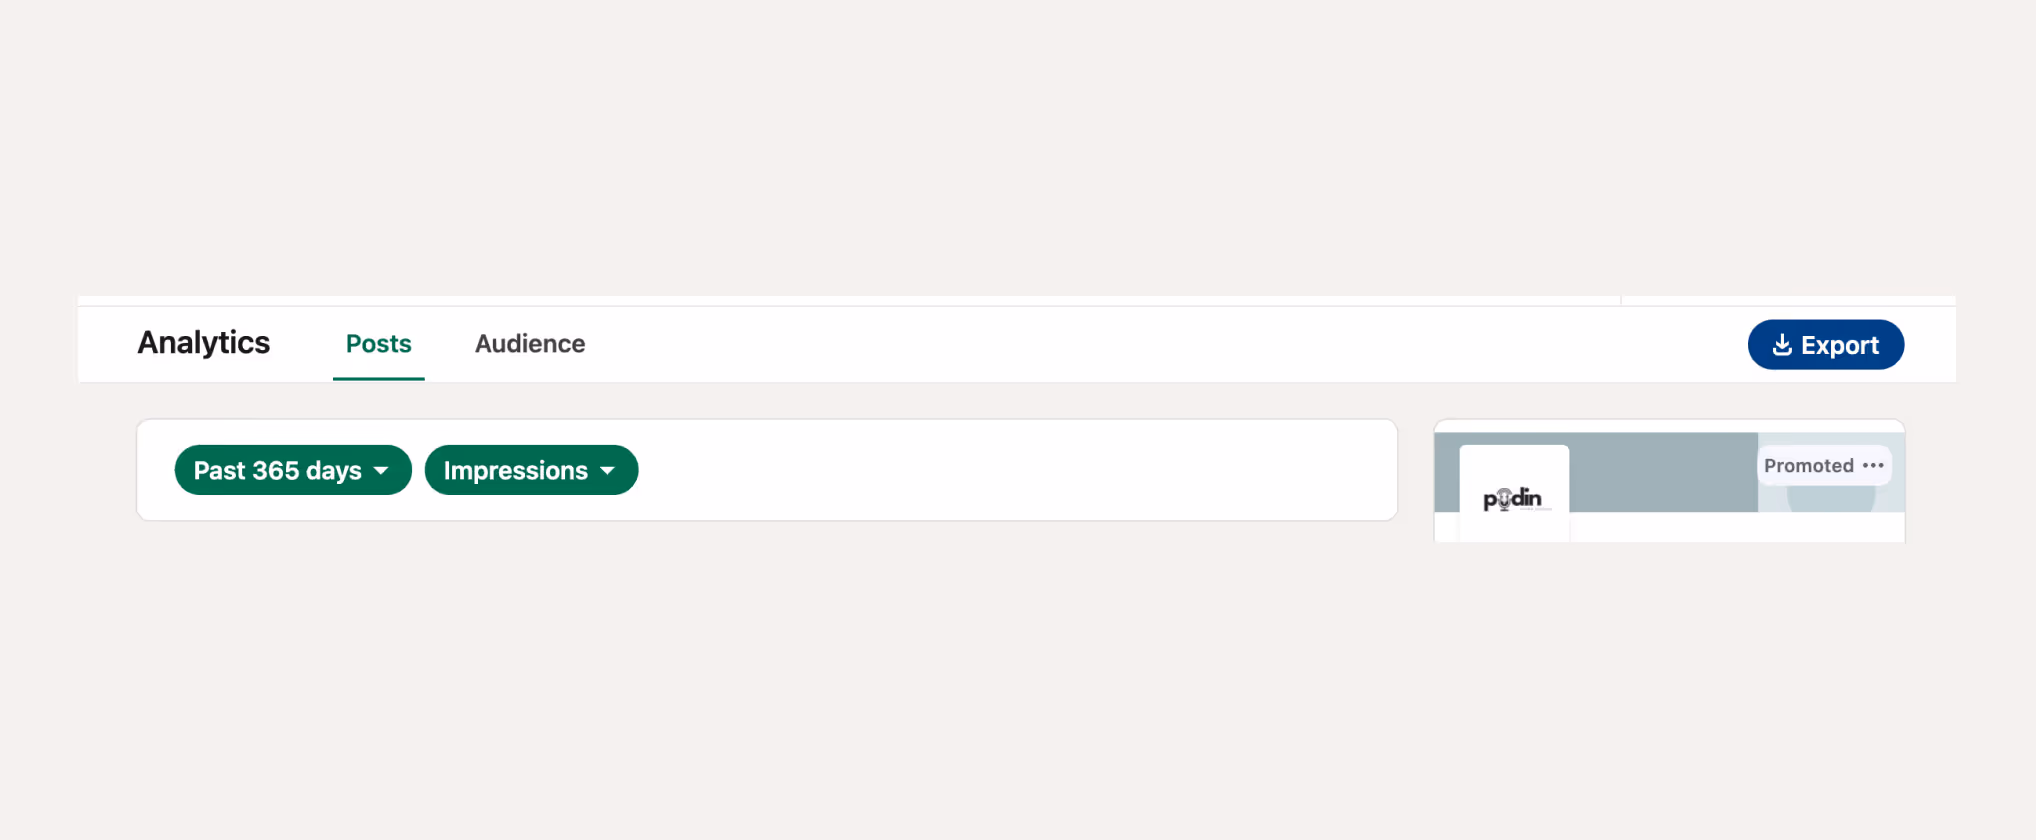
For Company Pages, head over to your LinkedIn Page, then click on the “Analytics” tab in the side bar.
From there you’ll see the blue “Export” button in the top righthand corner. You’ll then select the timeframe you want to export analytics into an Excel or CSV file.
Note: LinkedIn exports data as XLS (Excel) files. You can open these directly in Excel or convert them to CSV format for use in other analytics tools.
LinkedIn breaks analytics into several sections, and each one can be exported separately.
Exporting Visitor Analytics
Click into the Visitors section to see who's viewing your page. Select your desired date range using the dropdown menu in the upper right corner. LinkedIn allows you to export visitor data for time periods ranging from the last 7 days up to the past year. Click the Export button in the top right, and LinkedIn will generate an XLS file containing visitor demographics, including industries, job functions, seniority levels, locations, and company sizes of people viewing your page.
Exporting Content Performance
Navigate to the Content section to access post-level analytics. You can filter by date range and content type (posts, videos, articles). The export includes metrics like impressions, unique viewers, clicks, reactions, comments, shares, and engagement rates for each piece of content published during your selected timeframe.
Exporting Follower Data
The Followers section lets you download information about your audience growth and follower demographics. Your export will include follower counts over time, job functions, seniority, company size, industry, and location breakdowns of your follower base.
Exporting Search Appearances
The Search Appearances section shows you how people are discovering your Company Page through LinkedIn's search function. When you export this data, you'll see which search terms led people to your page, how many times your page appeared in search results, and how many clicks those appearances generated. This is valuable for understanding your page's visibility and optimizing your Company Page description.
Exporting Competitor Analytics
In the Competitors section, you can benchmark your performance against similar LinkedIn pages. The export includes comparative metrics like follower growth, content engagement rates, and posting frequency for your page versus your competitors. Note that this feature may require a LinkedIn Premium subscription depending on your account type.
Exporting Newsletter Analytics (if applicable)
If you publish a LinkedIn newsletter from your Company Page, you can export subscriber data and individual newsletter performance metrics. The export includes subscriber growth over time, open rates, engagement metrics, and demographic information about your newsletter audience. This section only appears if you've created a newsletter for your page.
Exporting Employer Brand Analytics (Premium feature)
The Employer Brand section is available for Company Pages with access to LinkedIn's Talent Solutions or specific premium tiers. When you export this data, you'll see metrics related to how job seekers are interacting with your page, including job post impressions, applications, and talent brand perception data. If you don't see this section, it's not included in your current LinkedIn plan.
Quick Tip: Not all sections may be visible on your Company Page. The analytics sections you see depend on your LinkedIn subscription tier and whether you've activated certain features (like newsletters). Focus on exporting the sections that are most relevant to your business goals.
How to Export Personal Profile Analytics From LinkedIn
Personal (Creator) profile analytics are harder to export than Company Page data because LinkedIn offers fewer built-in export options for individual accounts. Here, you can export two types of analytics into a spreadsheet: analytics for a specific post and analytics across all posts in a certain time range.
1. For a specific post: In order to export individual post analytics, you can do the following:
- Click on the “Me” icon in the top right corner, then select “Posts & Activity.”
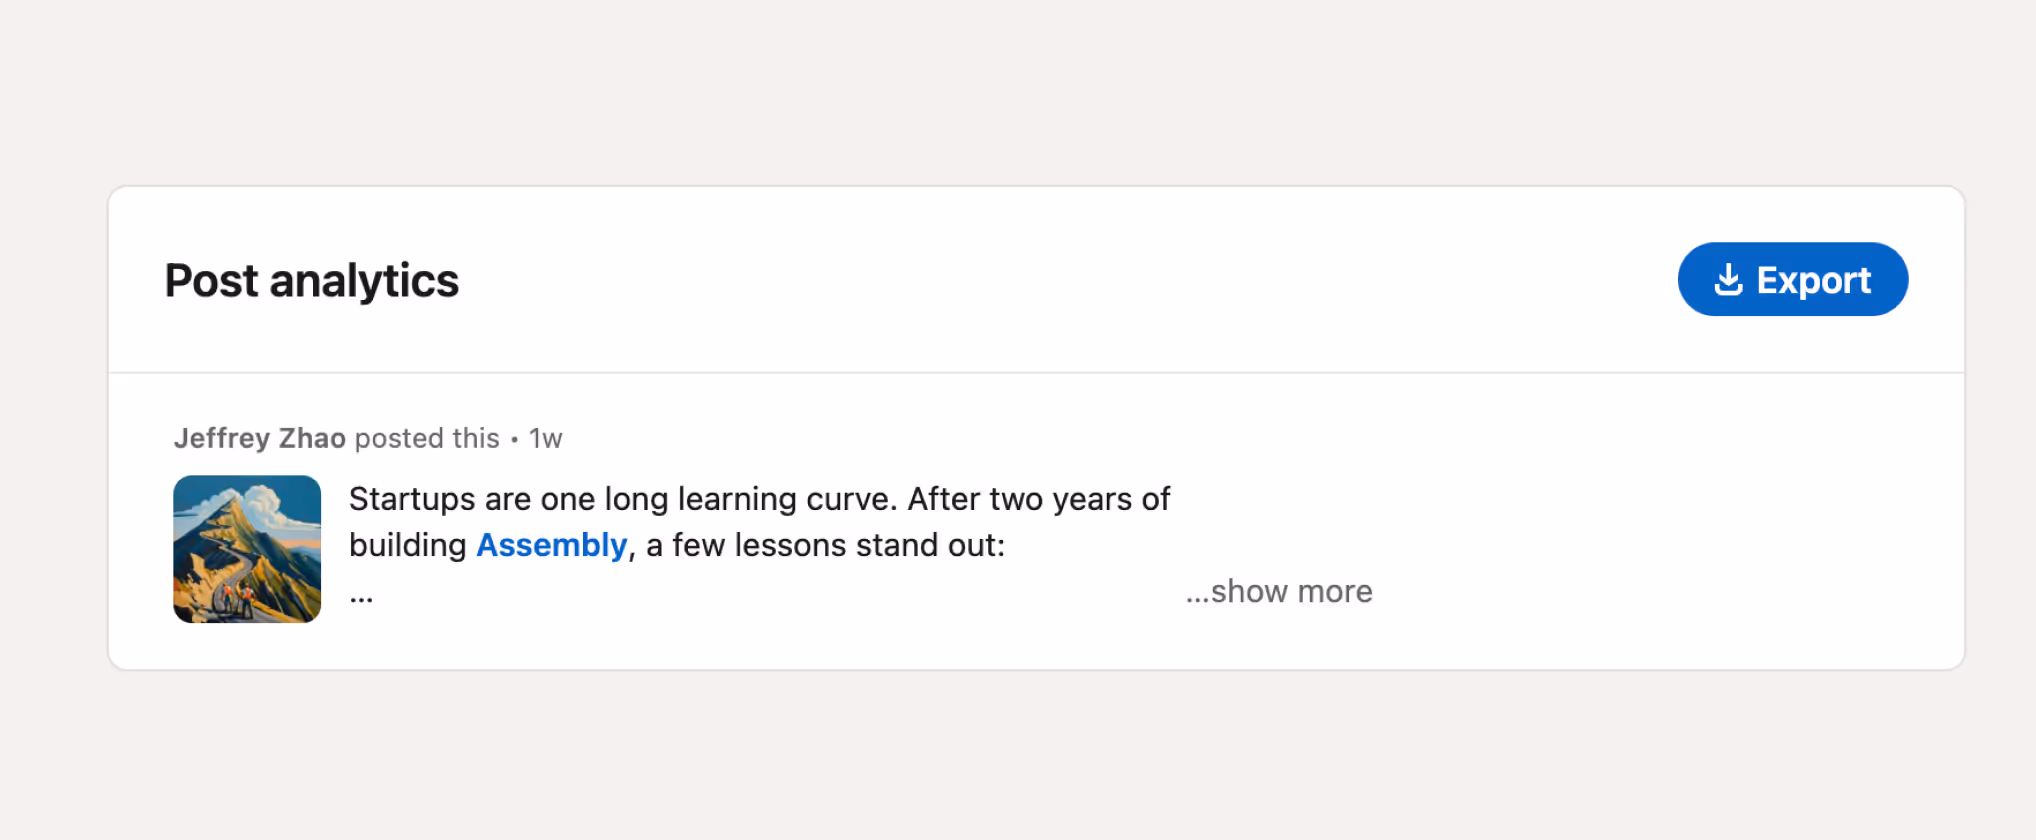
- Scroll to the specific post and click “View Analytics” in the bottom right hand corner.
- From there, you’ll see a blue “Export” button to download the analytics for that post.
2. For all posts in a timerange: If you’d like to download account level analytics on your Creator account, you can go to https://www.linkedin.com/analytics/creator/content/ and hit the “Export” button on the top right of your screen.
There’s also the ability to customize the timeframe that you’d like to export the analytics for.
Why Export LinkedIn Analytics?
Exporting LinkedIn analytics into a CSV or Excel file opens up a world of possibilities for data analysis and reporting. Here’s why it’s worth doing:
1. Large-Scale Performance Analysis
When you have weeks or months of data in one file, it’s easier to spot trends. You can analyze which post types generate the most engagement, which topics resonate with your audience, and how your content strategy evolves over time.
2. Upload Data into AI Tools (Like ChatGPT) for Insights
Once you’ve exported your LinkedIn data, you can upload the CSV file into AI-powered tools (like ChatGPT) to generate insights. You can ask:
• “What are the top-performing posts from this dataset?”
• “Which keywords or themes appear most frequently in high-engagement posts?”
• “What’s the best day and time to post based on past performance?”
This allows for instant data-driven decision-making without manually sifting through rows of data.
3. Share Reports with Your Team or Clients
CSV exports make it easy to create performance reports. You can quickly share LinkedIn analytics with your marketing team, clients, or stakeholders to showcase results and guide strategy discussions.
What You Can Learn From Your Exported LinkedIn Data
Once your data is in a spreadsheet, you can run analyses that LinkedIn's dashboard simply doesn't support.
Start by sorting your content exports by engagement rate to identify your top-performing posts. Look for patterns in what's working: Are posts with questions getting more comments? Do carousel posts outperform single images? Understanding how LinkedIn's algorithm works can help you identify these patterns. Are certain topics driving more shares? This pattern recognition helps you replicate success in future content.
Use follower demographic data to understand audience composition shifts over time. Compare follower demographics from January versus June to see if your audience is becoming more senior-level, shifting industries, or concentrating in specific regions. These trends inform your content strategy and targeting decisions.
Custom date range comparisons become possible with exported data. You can analyze how Q4 content performed versus Q1, measure campaign performance across specific launch windows, or track year-over-year growth metrics that LinkedIn's fixed reporting windows don't accommodate.
The real power is building your own reporting dashboards. Combine data from multiple exports to calculate custom metrics like cost-per-engagement if you're running LinkedIn ads, or track content velocity by measuring posts published per week against average engagement rates.
Common Limitations of LinkedIn's Native Export Features
LinkedIn's native export tools get the job done, but they come with real friction that slows down most marketing teams.
The biggest issue is that the process is entirely manual and siloed. Many teams fall into the same weekly routine: download exports every Monday morning, spend an hour cleaning up the data and fixing formatting issues, paste everything into a master spreadsheet, then build charts in time for Tuesday's team meeting. Scheduling posts on LinkedIn can help streamline this workflow. If you're managing multiple Company Pages or tracking several executives' personal profiles, multiply that time investment by each account. LinkedIn schedulers can help reduce this manual work.
Date ranges are another constraint. LinkedIn limits how far back you can export data, usually capping historical exports at 365 days for Company Pages and even shorter windows for personal profiles. If you want to analyze performance trends over multiple years, you need to have been manually downloading and archiving those CSVs all along.
Single-account access creates bottlenecks too. Only page admins can export Company Page data, which means your analyst or agency partner often has to request exports from someone else rather than pulling the data themselves when they need it.
That’s where Ordinal comes in.
A Better Way: Export LinkedIn Analytics as a CSV with Ordinal
If you're managing LinkedIn analytics regularly, you know that LinkedIn's built-in export tool has significant limitations. You're restricted to your own account unless you manually log in and out of multiple profiles, the available data isn't comprehensive, and custom filtering options are limited.
Ordinal transforms this process by offering a centralized dashboard that's faster, more flexible, and far more powerful.
Connect Multiple LinkedIn Profiles
One of Ordinal's most powerful features is the ability to connect and export analytics for any LinkedIn profile linked to your account - personal profiles, Company Pages, and executive accounts you manage. This is a game-changer for social media managers and agencies handling multiple accounts. No more requesting client login credentials or switching between accounts manually. Anyone with access to your Ordinal workspace can export analytics from any connected profile in seconds.
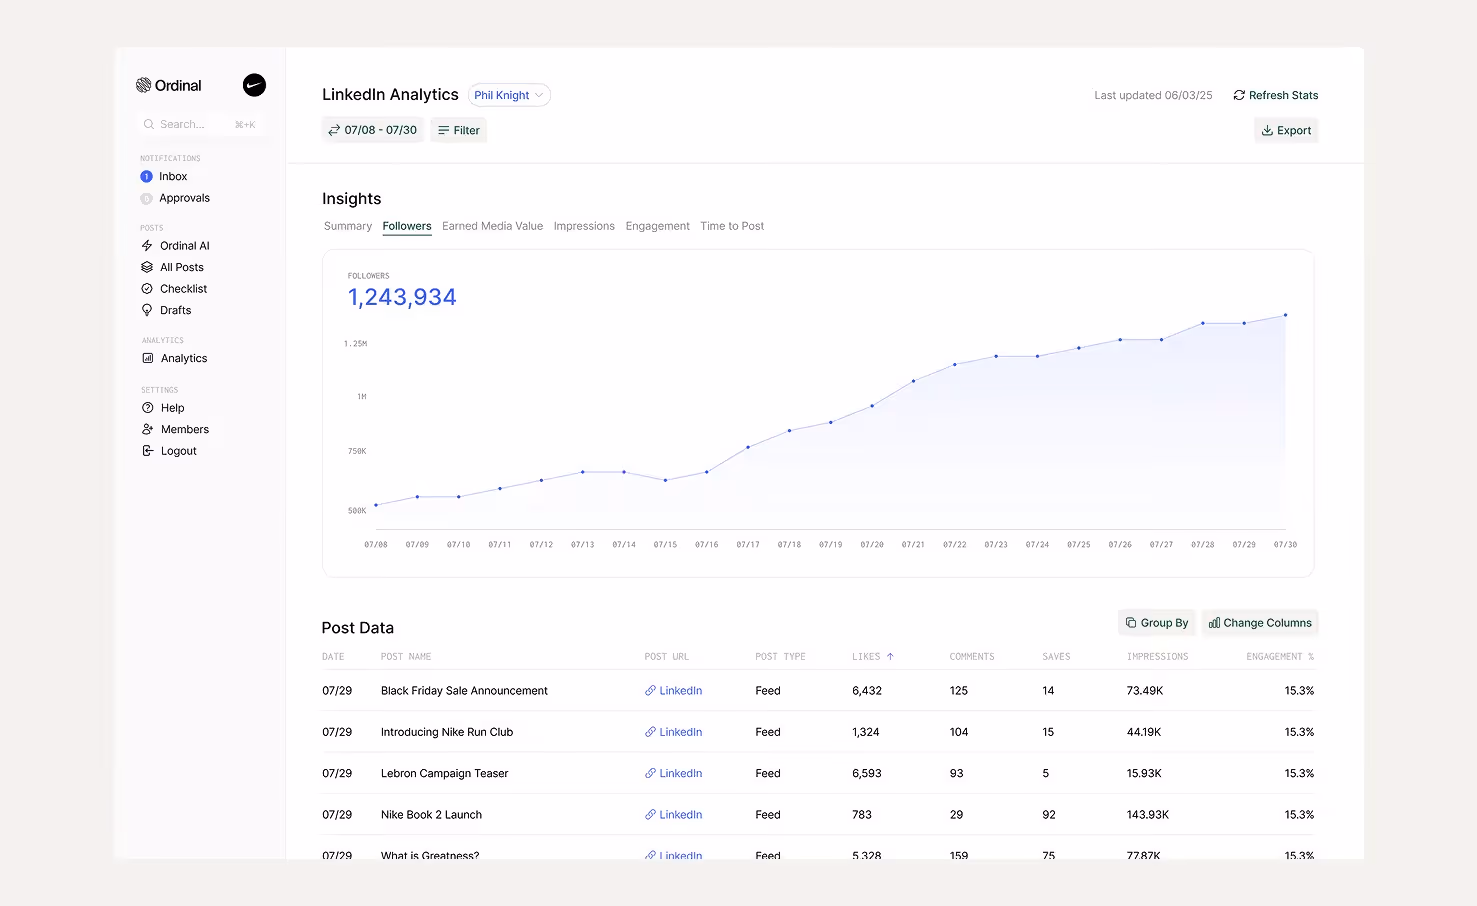
Export Comprehensive Data in One Click
Instead of navigating through multiple menus, Ordinal lets you download detailed LinkedIn analytics instantly. Your exports include everything you need for meaningful analysis:
- Post content (so you know exactly which posts performed best)
- URL of the post (making it easy to reference or reshare)
- Earned Media Value (the equivalent cost to drive the same number of impressions with paid ads)
- Post type (image, document, video, or text post)
- Engagement stats (likes, comments, shares)
- Impressions, reach, and engagement percentage
Filter by Custom Timeframes and Campaigns
Need insights from a specific campaign? Ordinal lets you filter analytics by custom date ranges that extend beyond LinkedIn's limits, or pull performance data for specific campaigns you've organized in the content calendar. This makes it easy to analyze trends and performance over time without being constrained by LinkedIn's default reporting periods.
Advanced LinkedIn Insights: See Who's Engaging
Where Ordinal really separates itself is visibility into who's engaging with your content. Our Advanced LinkedIn Insights show you exactly which individual profiles liked or commented on your posts. This granular data matters because it identifies warm leads and prospects showing active interest in your content - transforming basic engagement metrics into actionable business intelligence.
We built Ordinal for B2B teams that need to prove ROI from social content, not just track vanity metrics.
Automate Exports with the Ordinal API
For teams that need analytics data flowing into their own systems automatically, Ordinal offers an API that lets you programmatically export LinkedIn analytics without any manual action required.
Instead of logging in to download CSV files on a recurring schedule, you can set up automated workflows that pull LinkedIn data directly into your data warehouse, business intelligence tools, or custom dashboards. The API provides programmatic access to post performance metrics (likes, comments, shares, clicks, impressions, and engagement rates), follower growth data, and post content details across all your connected LinkedIn profiles.
This is particularly valuable for:
- Data teams building centralized marketing dashboards that combine LinkedIn metrics with data from other channels
- Agencies managing dozens of client accounts who need scheduled, recurring data syncs
- Enterprise organizations requiring LinkedIn data in their data lakes for advanced analytics and attribution modeling
- Product teams integrating social performance data into internal tools and workflows
If you're building custom analytics solutions or need LinkedIn data integrated into your tech stack, the API removes the friction of manual CSV exports entirely.
Final Thoughts on Pulling LinkedIn Analytics
Learning to export analytics from LinkedIn opens up analysis options that the built-in dashboard simply doesn't offer. You can track long-term trends, compare performance across custom timeframes, and identify exactly which content types resonate with your audience. The manual export process works for occasional checks, but it becomes a bottleneck when managing multiple accounts or proving ROI from social content.
Ordinal eliminates the friction of manual exports while adding capabilities that transform how you use LinkedIn data. Connect all your profiles in one place, export comprehensive analytics in seconds, and identify exactly who's engaging with your content so your sales team can follow up on warm leads.
Ready to streamline your LinkedIn analytics workflow? Start your free trial of Ordinal and see the difference.
FAQ
How far back can I export LinkedIn analytics data?
LinkedIn limits historical exports to 365 days for Company Pages and shorter windows for personal profiles, so you need to download and archive your data regularly if you want to analyze trends beyond that timeframe.
Can I export analytics from LinkedIn profiles I don't personally own?
Only page admins can export Company Page data directly from LinkedIn, but tools like Ordinal let you connect and export analytics from any LinkedIn profile linked to your workspace—personal profiles, Company Pages, and executive accounts—without needing to log in and out of multiple accounts.
What's the difference between Company Page and personal profile analytics exports?
Company Page exports focus on brand-level metrics like follower demographics, content performance, and visitor insights across your organization's content, while personal profile exports center on individual visibility, connection growth, and post engagement within your professional network.
Why should I export LinkedIn analytics instead of just viewing them in the dashboard?
Exporting your data into a spreadsheet lets you run custom analyses that LinkedIn's dashboard doesn't support, like tracking engagement trends over custom date ranges, comparing campaign performance across quarters, uploading data into AI tools for insights, and creating reports to share with your team or clients.
Related Posts
Looking to learn more? The below posts may be helpful for you to learn more about social media and content marketing.
.avif)