TL;DR
- Personal LinkedIn profiles average 9,265 impressions per post. Company pages average 1,386. People are your reach engine, not pages.
- Posting 3–5 times per week is the sweet spot. Posts published within 12 hours of each other see 17% lower engagement.
- Multi-image posts lead on engagement rate (2.29%). Text-only posts lead on reach (7,737 average impressions).
- Tags, first-hour engagement, and format selection move the needle more than posting volume.
- Paid LinkedIn ads cost $310 per lead on average for B2B SaaS. Organic costs $164.
This guide is built on 256,356+ LinkedIn posts analyzed by Ordinal, plus published research from LinkedIn, Buffer, and HubSpot. Every recommendation has a number behind it.
Why Most LinkedIn Strategies Fail
The biggest structural mistake in B2B LinkedIn marketing is leading with company pages.
Company pages average 1,386 impressions per post, while personal profiles average 9,265. That's a 6.7x gap. Organic reach on company pages has dropped roughly 60% since 2024, and a typical company page post now reaches only 1.6% of its own followers.
LinkedIn's algorithm has shifted toward human-to-human content. Personal posts now account for 39% of what users see. Company page content sits at 1–2%.
That doesn't mean company pages are useless. They convert well on engagement rate (1.56% vs. 0.91% for personal profiles), which makes them a solid hub for product updates, job posts, and announcements.
They just can't carry your reach strategy.
Clay, beehiiv, and Replo have all built their LinkedIn programs around personal profiles for reach, with company pages as a support layer. That's the model that works in 2026.
Personal Profiles vs. Company Pages

Post from personal profiles for reach. Use company pages for credibility and warm-audience conversion.
Personal profiles (founders, executives, practitioners) should carry 70–80% of your content volume. They generate the most organic reach, get more algorithmic boost from engagement, and build the trust that converts pipeline. Our analysis of declining company page reach shows personal profiles now generate 561% more reach than company pages.
Company pages should publish 3–5 times per week: product updates, customer stories, team milestones, curated content. Their value is legitimacy. Prospects go looking for your company page before they buy. A complete page generates 30% more weekly views (LinkedIn data), and profiles that link back to a polished page convert better in the consideration stage.
If you're running an executive or employee advocacy program, coordinate posts so personal and company content don't publish within 12 hours of each other. The algorithm treats stacked posts from the same network as competition for the same attention.
Content Format Strategy

Based on 256,356 LinkedIn posts:
1. Text-only: 7,737 avg. impressions, 0.93% engagement rate
2. Single image: 5,129 avg. impressions, 1.66% engagement rate
3. Multi-image: 5,453 avg. impressions, 2.29% engagement rate
4. Document/carousel: 4,895 avg. impressions, 1.60% engagement rate
5. Video: 5,021 avg. impressions, 1.44% engagement rate
6. Poll: 3,713 avg. impressions, 0.37% engagement rate
Different formats serve different goals.
For reach, text-only posts win. 7,737 average impressions versus 3,713–5,453 for visual formats. The algorithm rewards content that keeps users on LinkedIn, and text posts trigger dwell time signals when people stop to read.
For engagement, multi-image posts win at 2.29%, followed by single images (1.66%) and carousels (1.60%). Carousels also register page-swipe engagement, which LinkedIn's algorithm reads as a strong dwell indicator.
Polls underperform despite being a native format. 0.37% engagement, the lowest of anything in the dataset. They generate responses, but responses don't seem to signal content quality to the algorithm the way comments do.
For most B2B accounts, a workable rotation is 2–3 text-only posts per week for reach, 1–2 image or carousel posts for engagement, and occasional video. Our guide to carousel posts goes deeper on production and strategy.
Post Length
Short posts (under 300 characters) have the highest engagement rate at 1.19%. Very long posts (1,500+ characters) average 10,393 impressions, roughly 4x the reach of short posts, but engage at 1.08%.
The difference is small enough that it comes down to what you're optimizing for on any given post.
Short posts work for opinions, quick data points, anything where you want fast engagement signal. Long posts work for thought leadership, educational content, and building the perception that you're worth following.
The "see more" cutoff on LinkedIn appears after roughly 140–210 characters. Your hook has to earn the expand click. Our guide to LinkedIn post formatting covers this in detail, including how bold and italic formatting can guide the reader's eye.
Posting Frequency
Three to five posts per week.
Engagement rate is flat from 1 to 6 posts per week, ranging from 1.81% to 1.88%. Posting more doesn't suppress engagement.
But it does affect reach efficiency: at 3–5 posts per week, each additional post adds 1,000–1,476 average impressions. At 6+ per week, the marginal gain per post starts declining.
Follower growth scales with volume: accounts posting 21+ times per month add an average of 729 followers per month, compared to 163 at 1–4 posts. The efficiency gains are largest in the 5–20 posts/month range. After that, you're working harder for smaller increments.
Finally, you should space posts at least 24 hours apart. Posts published within 12 hours of each other see 17% lower engagement. Two posts competing in the same window eat each other's audience.
Our posting frequency guide covers the full methodology.
When to Post
Based on aggregate data across thousands of accounts:
Best days: Tuesday, Wednesday, Thursday.
Best times: 7–9:30 AM, 10 AM–1 PM.
Weekends and Friday afternoons drop off. Engagement falls as the professional mindset leaves the building.
Your own data is more reliable than any benchmark. If your audience is in a different time zone or works non-traditional hours, your peak windows will shift. Check when past posts generated the most engagement in the first two hours.
What matters more than the exact posting time is whether you can respond to comments in the first 60 minutes. A post that gets 10 comments in the first hour will out-distribute a post that gets 40 comments spread across 6 hours. Early engagement is the algorithm's strongest signal.
The First-Hour Engagement Problem
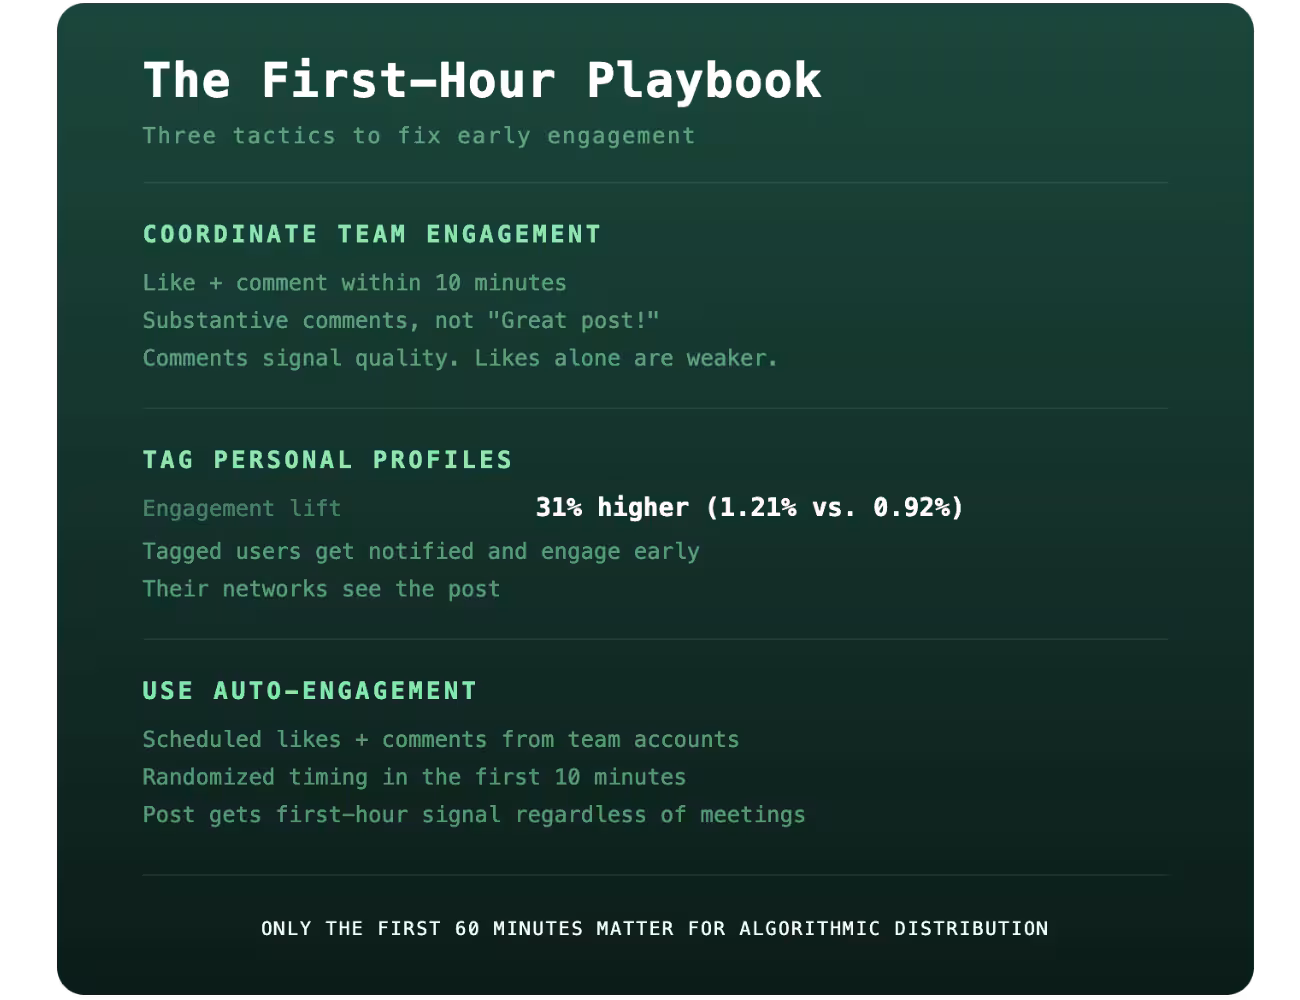
LinkedIn evaluates content in two stages: the first distribution wave (0–60 minutes) and the second wave (hours 1–6). Content that performs in the first hour gets pushed further in the second.
Most teams run into the same problem. A post goes live at 8 AM. By 9 AM, half the team is in meetings and nobody has engaged. The algorithm reads that as weak content and limits distribution.
Three ways to fix it.
1. Coordinate team engagement: Get team members to like and comment within the first 10 minutes. Substantive comments that extend the conversation, not "Great post!" Comments signal quality engagement. Likes alone are weaker.
2. Tag personal profiles: Posts with personal profile tags see 31% higher engagement (1.21% vs. 0.92% without tags). Tagged individuals get a notification, tend to engage early, and their networks see the post.
Personal profile tagging is one of the few tactics with a direct, measurable lift.
3. Use auto-engagement tools: Ordinal lets you schedule automatic likes and comments from team members' accounts, with randomized timing, firing within the first 10 minutes.
The post gets its first-hour engagement regardless of what else is happening that day.
Posting Strategy by Role
1. Founders and Executives
The founder playbook works because decision-makers trust individuals before they trust brands. A founder post gets 5x more engagement than the same content from a company page.
Most founders can sustain 1–2 posts per week from scratch but can't maintain 3–5. The answer is a ghostwriting and approval workflow: a content team drafts based on the founder's voice and past content, the founder reviews and approves, and nothing goes out that doesn't sound like them.
Our guide to founder LinkedIn content covers 100+ post ideas organized by funnel stage.
2. Social Media and Content Managers
The work here is operational: managing approvals across multiple profiles, making sure posts don't go live without sign-off, tracking which formats and topics perform, and coordinating engagement across the team.
One post that errors out silently and goes unpublished for three days can waste a week of content planning. Tooling matters more here than most teams want to admit.
3. Agencies Managing Executive Accounts
Agencies running 20–40 client accounts face every operational pain at scale. Approval workflows, version history, personal tagging, PDF carousel support: these are non-negotiable, and most schedulers don't have them. Ordinal for agencies is built around this use case.
4. Employee Advocacy
Only 3% of employees share content about their company. Those 3% generate roughly 30% of total engagement on company posts.
A company with 50 employees, each with 800 connections, has potential reach of 40,000 people with zero ad spend. Employee-shared content gets 8x more engagement than company page content. IBM found that leads sourced via employee content convert 7x more often than those from paid channels.
The gap between that potential and reality is operational. Teams don't have a system, so it stays ad-hoc. Occasional Slack messages asking people to like a post. Ignored by 90% of the team.
A functioning program needs content that's easy to engage with (a URL and a suggested comment, not a request to write from scratch), a consistent notification mechanism (Slack boost channels or direct pings), and enough visibility into who engaged that there's lightweight accountability without micromanagement.
beehiiv's team built a program generating 300,000+ monthly impressions through employee advocacy.
And Clay's single-person social team grew from 8,000 to 120,000 followers in one year by running a 25-person advocacy program through Ordinal.
Organic vs. Paid

Organic LinkedIn content costs $164 per lead on average for B2B SaaS. LinkedIn ads cost $310. Organic posts average 2–6% engagement. LinkedIn feed ads average 0.44% click-through.
LinkedIn ads aren't a bad channel, but they're a specific tool for specific jobs.
Organic is better for building trust and familiarity over the months before someone is ready to buy. Most B2B purchase cycles are long and consistent organic presence during that window matters.
Ads work best for accelerating campaigns with a defined audience: webinar registrations, quarter-end pushes, retargeting people who've already engaged with your content. The best use of LinkedIn ad budget is amplifying organic content that already proved its message-market fit, not running cold campaigns from scratch.
Our full comparison of LinkedIn ads vs. organic content covers the ROI data.
How to Measure What's Working
Vanity metrics tell you what happened. They don't tell you why or what to do next.
The metrics that matter for B2B LinkedIn:
Engagement rate by impressions (not by followers). LinkedIn benchmark is 3.85–5.20%. Above 5% means your content is resonating.
Click-through rate. Organic CTR benchmarks are 0.5–2% for B2B. Above 2% signals strong message-market fit.
Follower growth rate, month-over-month, as a percentage. Absolute follower count is a lagging indicator. Growth rate tells you whether momentum is building or stalling.
ICP engagement. Who is liking and commenting? If your target accounts and job titles show up in engagement data, you're reaching the right people. This is the strongest predictor of pipeline impact.
Earned media value. What would these impressions have cost as LinkedIn ads? Gives you a dollar figure to present to leadership, calculated from your CPM.
Filter analytics by content type and label. If carousel posts are outperforming text-only by 40% on engagement, that's a budget allocation decision.
How Ordinal Helps Teams Execute This
Most teams have the strategy right, but they fall down on execution: posts that need approval sit in Slack threads for days, team members forget to engage, the scheduler can't handle PDF carousels or personal profile tags, and analytics are too shallow to show which content categories are working.
Ordinal is built for B2B teams that treat LinkedIn as a revenue channel. Personal profile tagging, auto-engagement with randomized timing in the first 10 minutes, Slack boost channels for engagement coordination, blocking approvals so nothing publishes without sign-off, label-based analytics that filter by content category, and native PDF carousel scheduling.
Again, teams like Clay, beehiiv, and Influent have used this to build LinkedIn programs that generate measurable pipeline. The case studies page has the specifics.
Frequently Asked Questions
What Is the Best LinkedIn Marketing Strategy for B2B in 2026?
Build around personal profiles, which average 9,265 impressions per post compared to 1,386 for company pages. Post 3–5 times per week, weight your format mix toward multi-image and carousel posts for engagement, and use text-only posts for reach. Layer paid amplification on organically validated content rather than running cold ads as your primary acquisition channel.
How Often Should You Post on LinkedIn?
Three to five times per week. Pages posting weekly see 5.6x more follower growth than irregular posters (Buffer data). Space posts at least 24 hours apart, since posts published within 12 hours of each other cannibalize each other's reach. Our posting frequency data covers this in depth.
What's the Best Content Format on LinkedIn?
Multi-image posts have the highest engagement rate at 2.29%, followed by single-image (1.66%) and document/carousel (1.60%). Text-only posts get the most reach at 7,737 average impressions but the lowest engagement at 0.93%. Polls perform worst at 0.37%. Based on 256,356 posts.
Should You Post From Your Personal Profile or Your Company Page?
Both, but weight toward personal profiles. Personal profiles average 9,265 impressions per post versus 1,386 for company pages, a 6.7x gap. Company pages convert better on engagement rate (1.56% vs. 0.91%), so they work as a warm-audience hub for product updates rather than as your primary reach engine.
How Long Should a LinkedIn Post Be?
Depends on the goal. Short posts under 300 characters have the highest engagement rate at 1.19%. Very long posts (1,500+ characters) average 10,393 impressions but engage at 1.08%. Short posts for conversation, long posts for reach.
Does Tagging People Boost LinkedIn Post Performance?
Yes. Posts with personal profile tags get 31% higher engagement (1.21% vs. 0.92%) based on 256,356 posts. Tagged people get a notification and tend to engage early. That first-hour engagement signals the algorithm to distribute the post more widely.
Are LinkedIn Ads Worth It Compared to Organic?
For most B2B teams, organic should be the foundation and ads the accelerant. Organic LinkedIn content averages $164 per lead versus $310 for ads. Ads work for time-sensitive campaigns and for amplifying organic content that already proved its message-market fit.
Related Posts
Looking to learn more? The below posts may be helpful for you to learn more about social media and content marketing.