
Ordinal Data Lab is a series where we dig into our dataset of millions of social media posts to answer the questions marketers actually care about. Just data, no guesswork.
Everyone has an opinion about how often you should post on LinkedIn.
"Post every day." "No, 2-3 times a week is enough." "Actually, you should post twice a day." The advice is everywhere, and almost none of it is backed by real data.
We have access to real LinkedIn performance data from thousands of accounts through Ordinal - so we pulled 250,000+ posts, cleaned the data, and ran the numbers ourselves.
Some of what we found confirms conventional wisdom. Some of it doesn't.
The short answer: Post 3-5 times per week on LinkedIn. Our data shows this range delivers the best balance of engagement (1.81-1.86%), reach efficiency (+1,000-1,476 impressions per additional post), and follower growth. Space posts at least 24 hours apart. Never post twice in the same day.
Key Findings
- Engagement rate barely moves from 1x to 6x per week - it hovers between 1.81% and 1.88%. The only real drop is at 7+ posts/week (1.56%).
- Per-post reach does decline gently as you post more - 1x/week gets a median 1,173 impressions per post vs. 866 at 6x/week - but it's a slope, not a cliff.
- Total weekly reach scales almost linearly with frequency, from 1,173 impressions at 1x/week to 12,771 at 7+/week.
- The biggest marginal return is at 3-4x/week, adding 1,324-1,476 incremental impressions per step. After 5x/week, returns soften.
- Your first three posts of the week perform identically (~1.84-1.85%). Decay starts at Post #4 and gets steep at Post #7+ (1.33%).
- Spacing matters more than people think. Posts published within 12 hours of each other see 17% lower engagement. Anything over 24 hours is fine.
- Follower growth scales with frequency, from +163/month at 1-4 posts to +729/month at 21+ posts, but the efficiency gains are biggest in the 5-20 posts/month range.
About This Study
This analysis covers 250,000+ LinkedIn posts tracked through Ordinal, spanning thousands of accounts, from personal brands with a few hundred followers to company pages with 50,000+. The data is primarily from 2024-2026, reflecting the current LinkedIn algorithm.
We also published a companion study on how links in LinkedIn posts affect reach, another common myth we tested against data.
How we ran the analysis:
- Engagement rate = (likes + comments + shares + reposts) / impressions. We excluded clicks because clicks measure curiosity, not resonance, and including them inflates the metric
- Grouped accounts by posting frequency using their average posts per calendar week
- Used median values throughout to prevent outliers from distorting the picture
Does Posting More on LinkedIn Hurt Your Engagement Rate?
The myth: "If you post too often, each post gets less engagement. Quality over quantity."
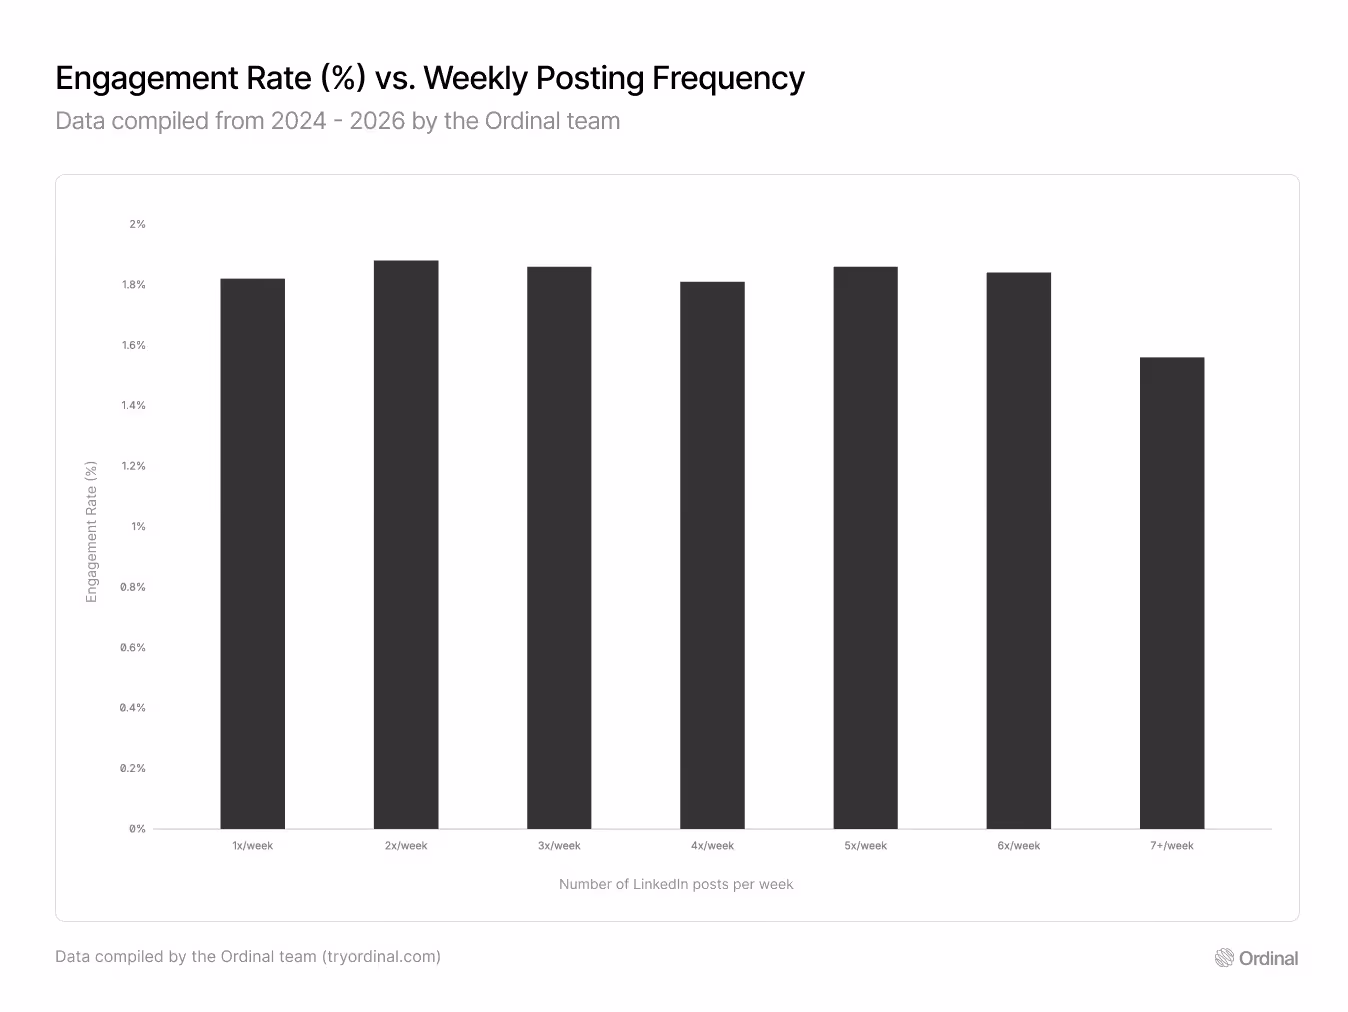
Engagement rate is flat from 1x through 6x per week. The entire range sits between 1.81% and 1.88%, a 0.07 percentage point spread that's basically noise. There is no engagement penalty for posting up to 6 times per week.
The drop at 7+ posts/week (1.56%) is real but moderate, about 16% below the 2x/week peak. That's far less dramatic than the "posting kills your engagement" crowd suggests.
To put this in context: the difference between posting once a week and six times a week is 0.02 percentage points of engagement. That's not a tradeoff. It's a rounding error. The flatness itself is the finding. Your audience doesn't get tired of you at moderate posting frequencies. The 7+/week drop is more likely an algorithmic effect than audience fatigue. LinkedIn's distribution engine starts spreading your content thinner across posts when you publish that often.
Bottom line: Posting 2-6 times per week doesn't hurt your per-post engagement. The "quality over quantity" warning only applies once you're posting multiple times per day.
Does LinkedIn Throttle Your Reach When You Post More?
The myth: "LinkedIn punishes frequent posters by showing each post to fewer people."
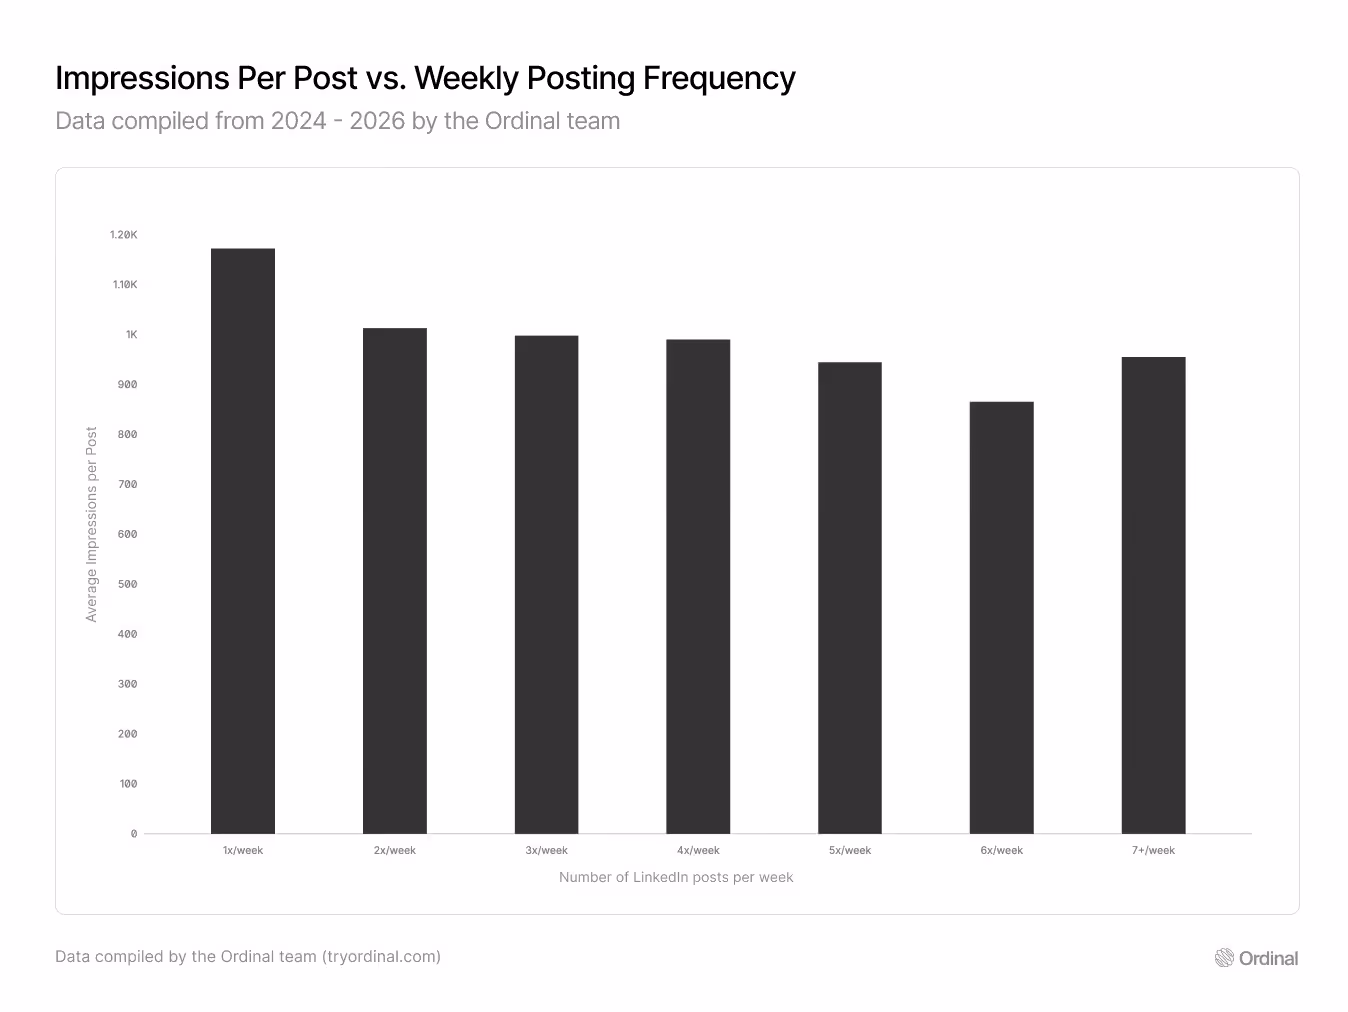
There is a mild downward trend, about a 26% drop from 1x/week (1,173 impressions) to 6x/week (866). So less frequent posters do get slightly more eyeballs on each individual post.
But look at where the steepest drop happens: the 1x→2x step accounts for 160 of the total 307 impression decline. After that, each additional post per week only costs roughly 20-40 impressions. The "reach tax" front-loads. If you're already posting twice a week, going to five barely changes your per-post reach.
The 7+/week bucket actually rebounds slightly to 955 impressions per post, higher than 6x/week. This is likely because very high-frequency posters tend to be larger, more established accounts with bigger audiences.
Bottom line: LinkedIn gives a slight per-post reach edge to less frequent posters, but it's not a "penalty." It's a small tradeoff. As we'll see next, total weekly volume more than makes up for it.
Does Total LinkedIn Reach Keep Climbing With More Posts?
Even if each post gets slightly fewer impressions, does posting more grow your total weekly visibility?
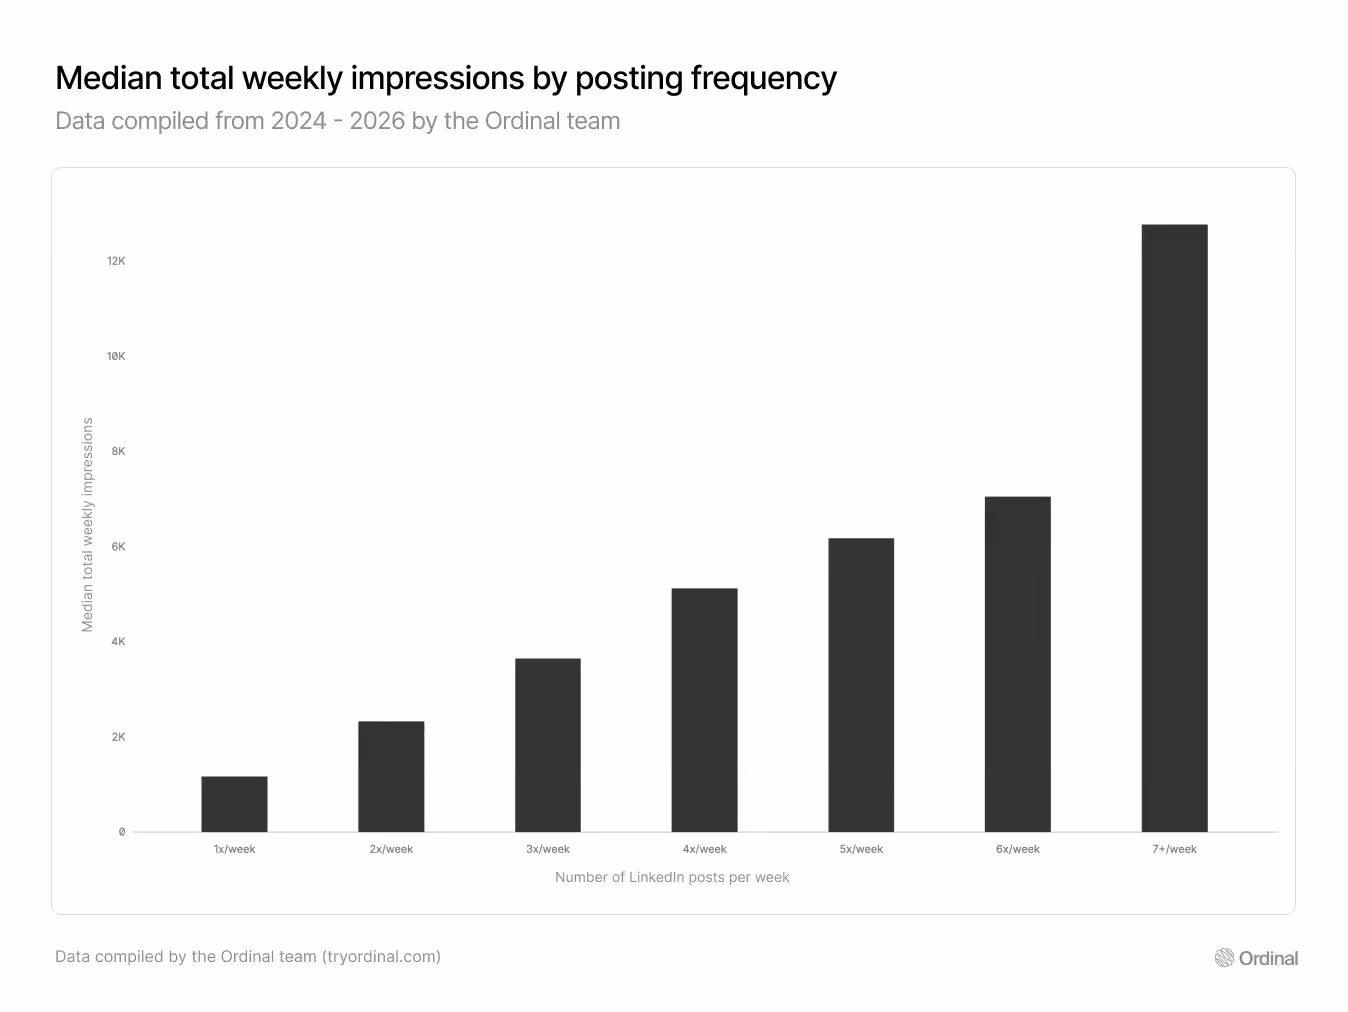
Yes, unambiguously. Going from 1 to 5 posts/week 5.3x's your total weekly impressions. At 7+/week, you're looking at nearly 11x the reach of posting once a week.
Notice something about the 1x and 2x numbers: 1,173 and 2,326. That's almost exactly 2x. This near-perfect doubling suggests LinkedIn distributes each post roughly independently. The algorithm isn't dividing a fixed weekly "reach budget" among your posts; each post gets its own shot at distribution. That's a meaningful algorithmic insight, and it's good news: it means your second post of the week isn't stealing from your first.
The math is straightforward: even though each individual post gets slightly fewer impressions at higher frequencies, the volume effect dominates. Five posts at 945 impressions each (4,725 total) crushes one post at 1,173 impressions.
Bottom line: If you're optimizing for total visibility, which is what most brands and creators care about, more posts always wins. The per-post reach decline is a footnote, not a headline.
What's the Optimal LinkedIn Posting Frequency? The Sweet Spot
This is the analysis nobody else publishes, and it's the most useful one here. Instead of just showing totals, we calculated the marginal value: how much incremental reach does each additional post per week actually deliver?
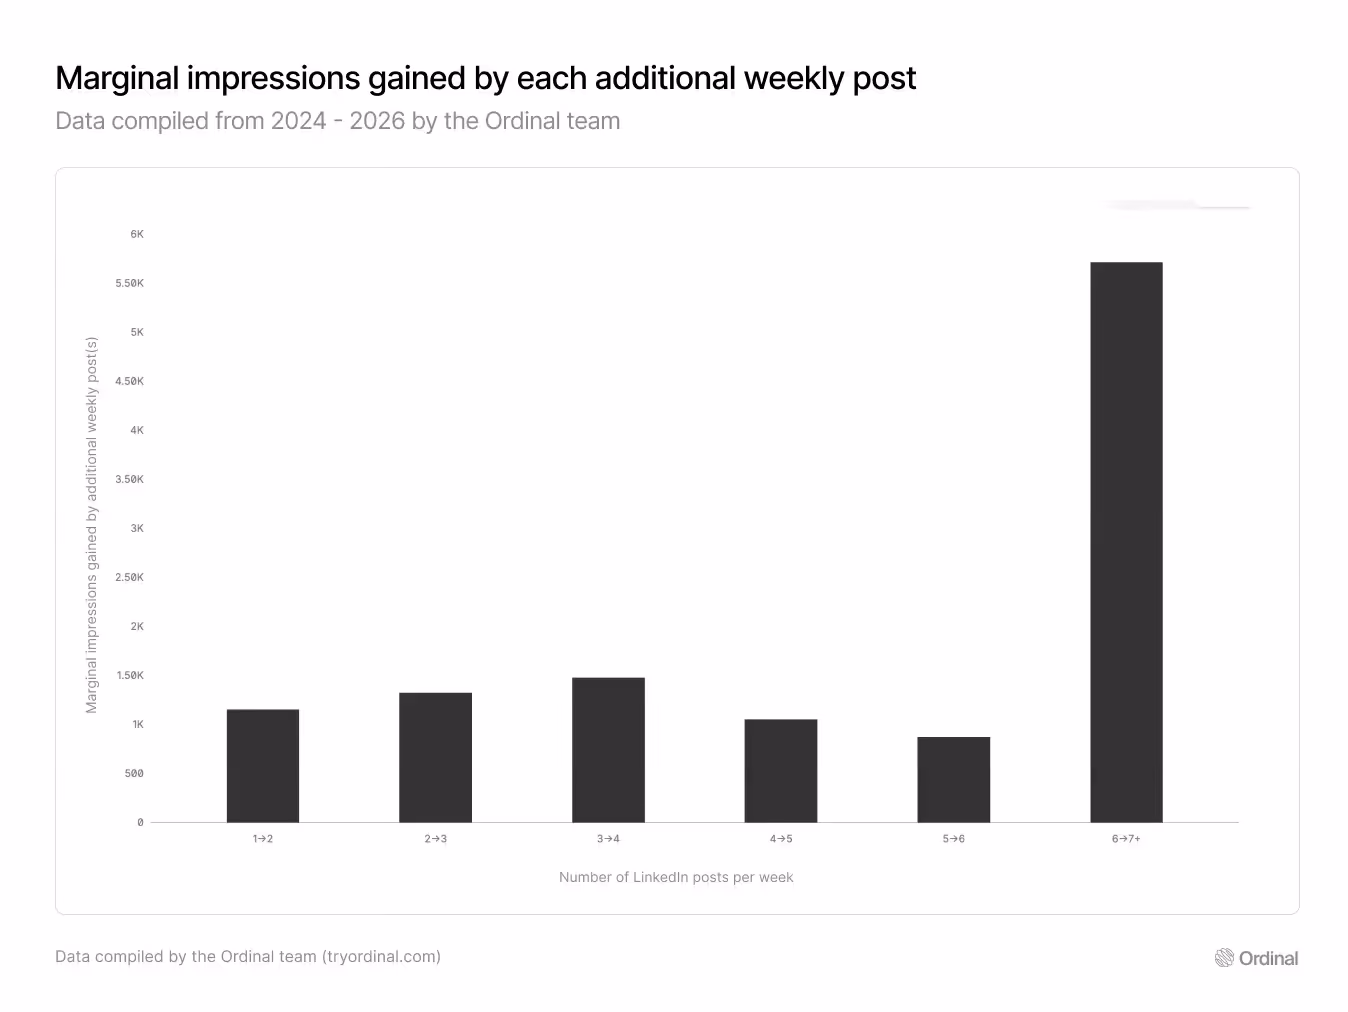
The highest return per additional post is at 3→4/week (+1,476 impressions). Every step from 1→5 delivers 1,000+ incremental impressions, all strong, consistent returns.
The consistency is itself the finding here. Most people assume diminishing returns kick in hard at 3 posts per week. They don't. Posts 2, 3, 4, and 5 all deliver roughly the same incremental value. There's no cliff, just a gentle slope that starts softening at post 5 and becomes noticeable at post 6.
At 5→6/week, you're still gaining (+875) but at a noticeably lower rate. That's the point where you start asking whether the effort of producing another piece of content is worth the diminishing return.
The 6→7+ jump looks huge (+5,716), but that bucket lumps together all 7+ post weeks, so it's not a clean one-post comparison. It likely reflects heavier posting weeks from larger, more active accounts.
Bottom line: 3-4 posts per week is where each additional post earns the most incremental reach. Posts 1-5 all pull their weight. After 5/week, the effort-to-impact tradeoff gets worse.
Does Your 3rd Post of the Week Get Less Love Than Your 1st?
The myth: "Later posts in the week cannibalize earlier ones."
We ran a different kind of analysis here. Instead of grouping accounts by their average frequency, we looked within each account, ordering their posts chronologically within each calendar week (Monday through Sunday) and comparing engagement by position.
The first three posts of the week are identical: 1.84% to 1.85%. No difference between your Monday post and your Wednesday post. If you're worried about your second or third post of the week stealing attention from the first, don't be.
Posts #4 through #6 show a gentle decline (1.80% → 1.72%). That's a drop of about 0.08 percentage points across three posts. Noticeable in the data, but unlikely to affect your strategy.
The real break is at Post #7+, where engagement drops to 1.33%, a 28% decline from Post #1. The fact that #1-3 are identical but #7+ drops sharply tells us something: the decay isn't your audience getting sick of you. If it were audience fatigue, you'd see a steady decline from post #1. Instead, the pattern looks algorithmic. LinkedIn's distribution engine starts throttling at high volumes within a single week.
Bottom line: No cannibalization to worry about if you're posting 3-5 times per week. Your first three posts perform the same. The drop only gets meaningful at 7+.
How Far Apart Should You Space Your LinkedIn Posts?
The myth: "Spacing doesn't matter. Just hit your weekly target."
This is the finding nobody else has data on, and it might be the most practically useful part of this whole study. We calculated the time gap between each pair of consecutive posts from the same author and looked at how the second post in each pair performed based on the gap.
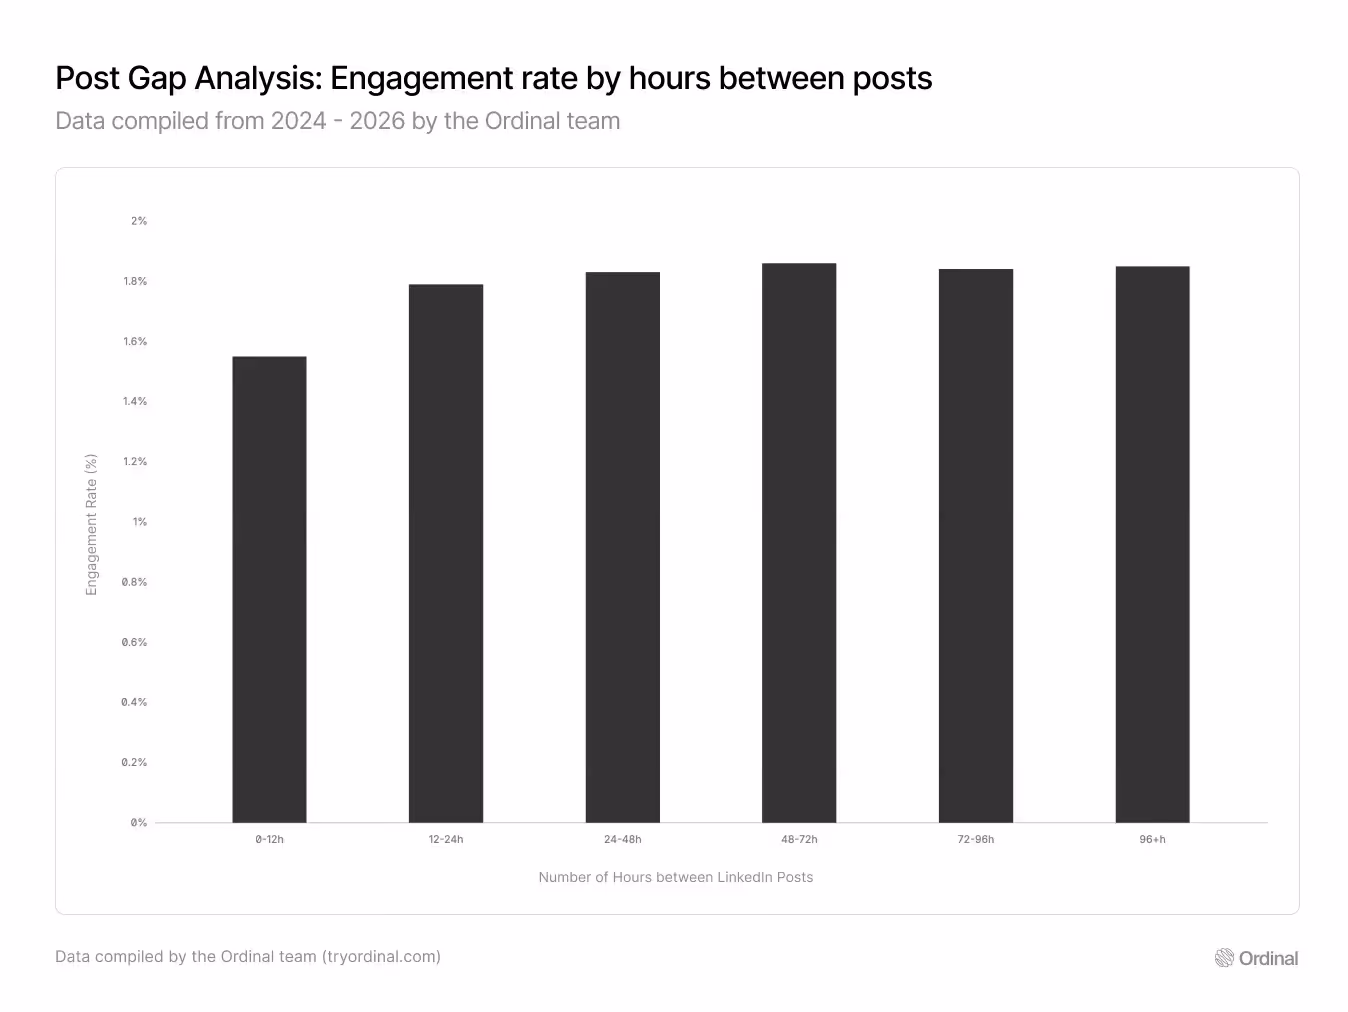
Posting twice within 12 hours is the worst-performing spacing in the dataset: 1.55% engagement, 17% below the 48-72h sweet spot. And this isn't a small sample artifact. There are 28,000+ posts in the 0-12h bucket.
The pattern is a step function: engagement jumps once you cross the 24-hour mark (1.55% → 1.83%), then flatlines. The difference between spacing posts 2 days apart and 4+ days apart is negligible, 1.83% vs 1.85%. The shape of this curve maps neatly to LinkedIn's known distribution window. Each post gets roughly 24-48 hours of active algorithmic distribution. Post again inside that window and you're pulling priority away from your own still-active content.
This has a practical implication that goes beyond just "don't post twice in one day." If you're scheduling posts, the exact time of day matters less than making sure there's at least a full day between them. A Monday 9am and Tuesday 3pm post (30-hour gap) will perform about the same as a Monday 9am and Thursday 9am post (72-hour gap).
Bottom line: Give each post at least 24 hours. If you're posting 3x/week, Monday-Wednesday-Friday. If 5x/week, every weekday. Just don't post twice in the same day.
Does Optimal LinkedIn Posting Frequency Depend on Your Account Size?
The myth: "These rules only work for big accounts."
To test this, we joined our post data with follower counts and segmented accounts into three brackets: under 1,000 followers, 1,000-10,000, and 10,000+. Within each bracket, we looked at how engagement rate varied by posting frequency.
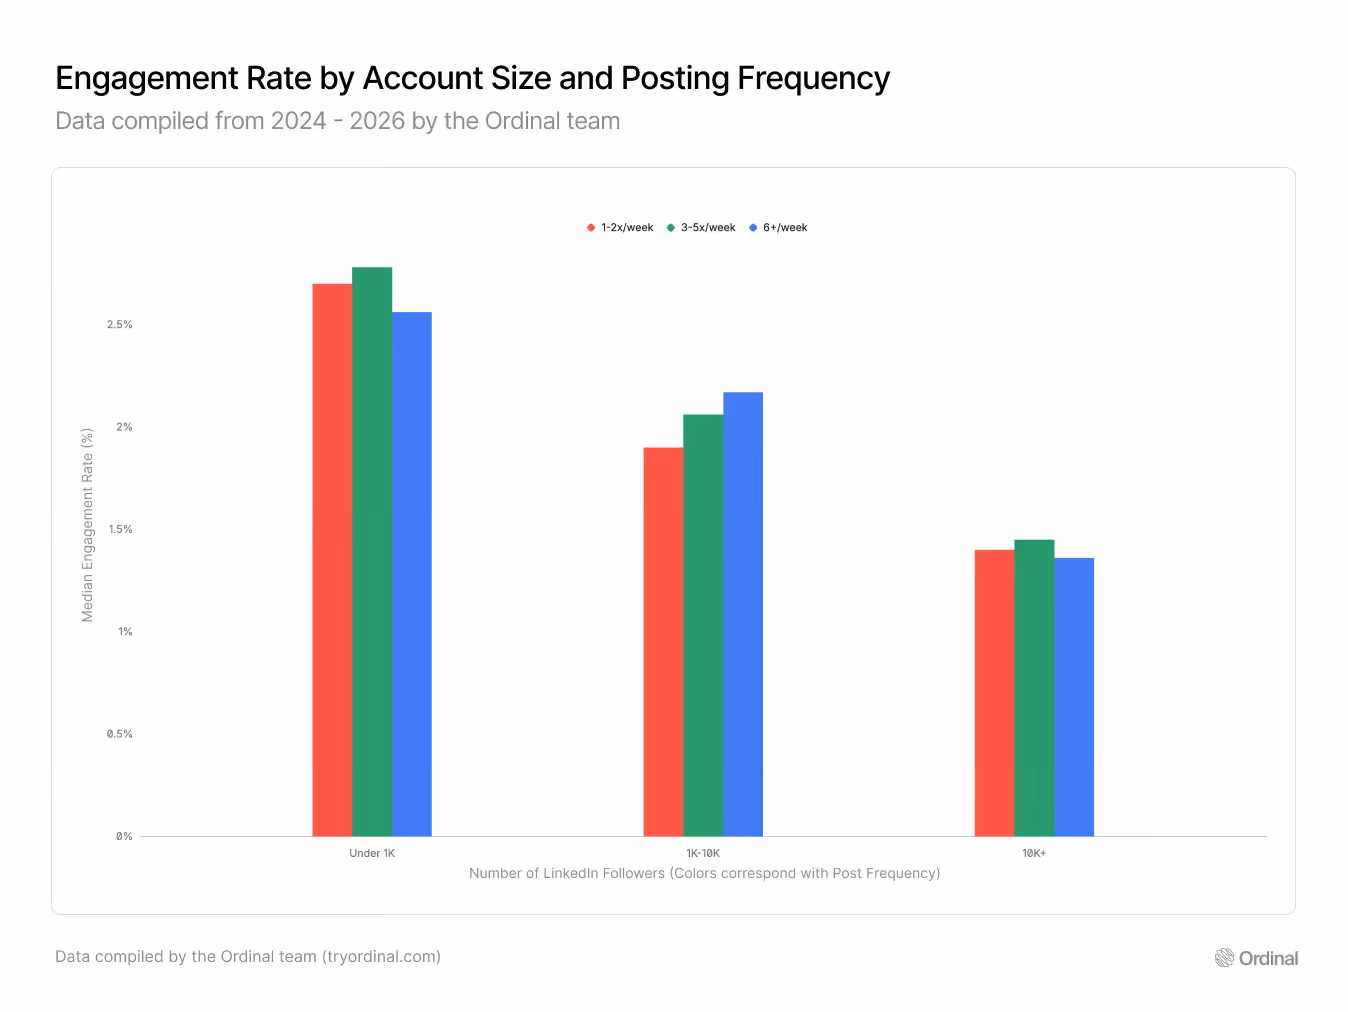
Two findings here.
First, smaller accounts get higher engagement rates across the board. Under-1K accounts see ~2.7% vs. 1.4% for 10K+. Tighter audiences engage more. Nothing new there.
What's more interesting is how the optimal frequency shifts by size:
- Under 1K: 3-5x/week wins (2.78%), slightly beating 1-2x (2.70%). But 6+/week drops to 2.56%, suggesting smaller accounts pay a steeper price for overposting.
- 1K-10K: Engagement increases with frequency. 6+/week has the highest rate (2.17%). These mid-size accounts seem to benefit the most from staying highly active. They're past the "too small to get reliable distribution" phase but haven't hit the audience passivity that comes with very large followings. Their followers are still actively curated and engaged, so more content gets rewarded rather than ignored.
- 10K+: 3-5x/week (1.45%) is best. Going higher drops engagement to 1.36%. Larger audiences are harder to keep engaged at high volume, possibly because the content quality bar is higher and the audience includes more passive followers who connected but don't actively engage.
Bottom line: Mid-size accounts (1K-10K followers) benefit the most from higher posting frequency. Large accounts should stick to 3-5x/week. Small accounts have flexibility either way but should be careful pushing past 5x/week.
Does LinkedIn Posting Frequency Affect Follower Growth?
Everything above is about per-post performance. But does posting more actually grow your audience over time?
To answer this, we joined monthly follower snapshots from LinkedIn with posting volume data for the same accounts and time periods.
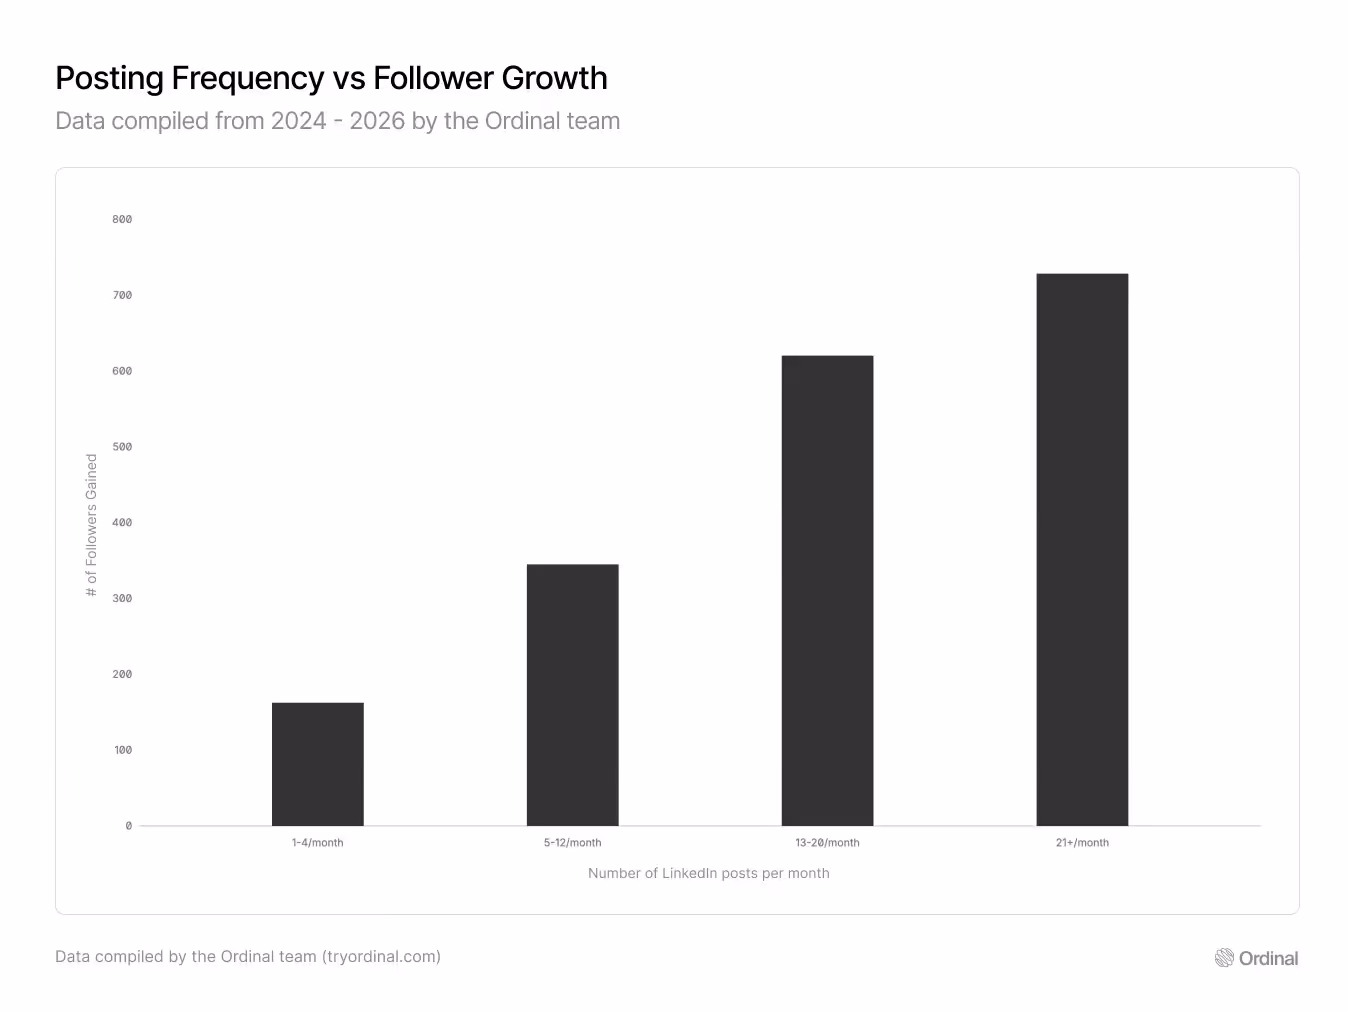
More posts = more followers, at every level.
The scaling is remarkably consistent: each bucket roughly doubles the previous one (163 → 345 → 620). That log-linear pattern suggests follower growth has a power-law relationship with posting volume. The first few additional posts per month have an outsized impact, and the returns gradually compress. The biggest jumps come from moving out of very low-frequency posting into a consistent cadence.
At 21+/month, growth still climbs to +729, but the incremental gain shrinks, only +109 more than the 13-20 bucket. You're still growing, but each additional post contributes less to that growth.
A caveat here: this is the chart most susceptible to reverse causation. Accounts that are already growing fast have more incentive to post often. We can't prove that posting more causes follower growth, only that they move together.
Bottom line: Post as much as you can sustain if followers are the goal. But the biggest efficiency gains are in the 5-20 posts/month range (~2-5 per week).
LinkedIn Posting Schedule: The Full Strategy
Eight analyses, one framework.
Posting 1x/week or less?
You're leaving reach on the table. Each additional post through 5x/week adds 1,000+ incremental weekly impressions. Going to 2x/week alone doubles your total reach. If you can only make one change to your LinkedIn strategy, make it this: go from one post a week to two or three.
Posting 3-5x/week? (the sweet spot)
This is the optimal zone. Engagement rate stays healthy (1.81-1.86%), each post still delivers strong marginal reach, and follower growth hits its biggest efficiency gains here. Your first three posts of the week perform identically, so don't stress about which day gets your best content. Just space them at least 24 hours apart.
Posting 6+ times/week?
Still adding total reach, but less efficiently. The 7th+ post of the week takes a real engagement hit (1.33%). This can work for mid-size accounts (1K-10K followers) where engagement actually improves with more posting, but most accounts will get more out of that time by commenting strategically or refining content quality.
Ideal amount of time to wait between posts?
Give each post at least 24 hours. Posting within 12 hours of your last post costs you 17% engagement. Beyond 24 hours, the exact gap doesn't matter. For a 3x/week schedule, Monday-Wednesday-Friday is a natural fit. For 5x/week, one post each weekday works well.
Personal profiles vs. company pages
Our dataset includes both personal profiles and company pages. The findings apply broadly to both, though company pages tend to post less frequently on average. LinkedIn's own guidance suggests company pages posting at least weekly see a 2x lift in engagement. Our data supports that as a floor, not a ceiling.
What This Study Doesn't Tell You
We want to be upfront about what the data can and can't prove.
We're comparing across populations, not running an experiment. Accounts that post 7 times a week are not the same people who post once a week with the volume turned up. They're often different types of accounts: more established, more resourced, or in different industries. We grouped by average posting frequency, which means we're comparing populations with different characteristics. The account size analysis helps control for one variable, but it can't control for everything.
The 7+ bucket is wide. Posting once a day and posting three times a day are lumped together in "7+/week." When you see the engagement drop or the follower growth spike in that bucket, remember you're looking at a mix of very different posting behaviors. The clean 1-6 individual buckets are more reliable for drawing conclusions.
We don't control for content format. Carousels, videos, text posts, and images all have different baseline engagement rates. If accounts posting 6+ times per week lean more on quick text posts (and they likely do, since it's hard to produce 6 carousels a week), some of the engagement decline could be a format effect, not a frequency effect.
None of this invalidates the findings. The patterns are consistent and the sample is large. But observational data from 250K+ posts is not the same as a randomized experiment. Use these numbers as strong directional guidance, not as exact predictions for your account.
Methodology
- Data source: LinkedIn post performance data tracked through Ordinal across thousands of accounts
- Sample: 250,000+ posts with 100+ impressions and valid engagement data (interactions ≤ impressions), primarily from 2024-2026
- Engagement rate formula: (likes + comments + shares + reposts) / impressions. Clicks excluded
- Statistical method: Median values throughout. Frequency buckets based on average posts per calendar week per account.
- Data cleaning: Excluded posts with <100 impressions and posts where interactions exceeded impressions (11,892 rows with clearly broken data). This removed ~15% of the raw dataset.
FAQ
How often should I post on LinkedIn?
3-5 times per week. Our analysis of 250,000+ posts shows this range maximizes reach efficiency and follower growth while keeping engagement steady at 1.81-1.86%.
Can you post too much on LinkedIn?
Yes, but the bar is higher than most people think. Engagement stays stable through 6 posts/week. The real drop is at 7+/week (1.56%). Per-post impressions also decline gently with higher frequency.
Does LinkedIn penalize you for posting too often?
There's a mild per-post reach reduction: 1x/week posts get 1,173 median impressions vs. 945 at 5x/week. But total weekly reach grows at every frequency level, so the "penalty" is more than offset by volume.
How far apart should LinkedIn posts be spaced?
At least 24 hours. Posts within 12 hours of each other see 17% lower engagement (1.55% vs 1.83%+). Beyond 24 hours, the exact gap barely matters. For a 3x/week schedule, Monday-Wednesday-Friday spacing is ideal.
Does posting frequency matter more for small or large accounts?
Mid-size accounts (1K-10K followers) benefit the most from high frequency. 6+/week showed the highest engagement at 2.17%. Large accounts (10K+) do best at 3-5x/week. Small accounts peak at 3-5x/week too.
Should I post every day on LinkedIn?
It depends. Mid-size accounts can benefit from daily posting. Larger accounts are better at 3-5x/week. The engagement cost of daily posting is small (1.84% at 6x/week vs. 1.88% at 2x/week), but the risk is content quality dropping.
What's better: posting 5 mediocre posts or 3 great posts per week?
3 great posts. Per-post impressions decline gently with frequency, and the engagement difference between 3x and 5x/week is essentially zero. Three well-spaced posts get nearly the same per-post results with less effort.
How often should a company page post on LinkedIn?
The same 3-5x/week recommendation holds for company pages. LinkedIn reports that pages posting at least weekly see 2x engagement. Our data suggests that's a minimum, not an optimum. If your team can sustain 3-5 quality posts per week, you'll significantly outperform weekly posting.
This is part of the Ordinal Data Lab series. We also analyzed whether links in posts hurt your LinkedIn reach, another common myth, tested against 900K+ posts.
About Ordinal
Ordinal is a social media management platform that gives marketing teams scheduling, collaboration, auto-engagement, and analytics tools for managing social media content. The dataset behind this study and the rest of the Data Lab series comes from posts published and tracked through Ordinal. Try it free →
Related Posts
Looking to learn more? The below posts may be helpful for you to learn more about social media and content marketing.