Around 2 million posts hit LinkedIn every day. That volume makes it easy to assume the feed is too crowded to break through, and most LinkedIn posts confirm the fear by going nowhere.
But posts that flatline don't fail because they're badly written. They fail because they're invisible. They have no early engagement, no algorithmic distribution, and (worst of all) no audience.
This playbook covers the full lifecycle: how to find ideas worth posting, write a hook that survives the see-more cutoff, choose the right format, time your posts, manage the first-hour engagement window, and measure what's working. It's built for B2B content managers and founders who want a repeatable system. Every step maps to a decision you'll make this week.
What Makes a LinkedIn Post Work in 2026
A LinkedIn post is a single update (text, image, carousel, video, poll, or document) published to a personal profile or company page, and it lives or dies on what happens in the first sixty minutes after it goes live. LinkedIn's algorithm reads early engagement signals to decide how broadly to distribute a post. Weak first-hour engagement caps reach permanently, and no amount of editing or reposting recovers it.
The other variable that matters before you write a word is personal profiles versus company pages. That means if your team posts exclusively from the brand page, you're starting with a structural disadvantage no hook can fix. Our personal profiles breakdown covers this in depth.
Everything else (format, timing, cadence) layers on top of those two mechanics. The lifecycle below runs in order for a reason.
Step 1: Finding Ideas Worth Posting
Ideas that map to a goal beat ideas that fill a calendar. The simplest framework is a content-type by goal matrix: awareness posts build reach, trust posts build credibility with people already in your orbit, and pipeline posts turn warm readers into conversations.
Pick which bucket you're filling before you draft.
The best idea sources for B2B teams are usually right in front of them, like customer calls, objections that surface in every sales conversation, or internal data nobody else is publishing. The best is when you have genuine (and data-backed) contrarian takes on advice everyone accepts as gospel.
Those generate original posts. Reposting news with no point of view and generic motivational content? Those posts do nothing but take time for your team to create.
For anyone building a new habit, the guide on consistent LinkedIn posting covers how to prime the pipeline without burning out in week two.
Step 2: Writing the Post (Hook, Body, and Length)
Post length tends to follow a U-curve. From what our team has seen, the weakest zone sits between 600 and 1,500 characters, long enough to feel like a commitment, short enough to deliver nothing. Here's a breakdown from our guide on post length but one good rule of thumb is to simply experiment first-hand. Track the length of your posts, along with engagement, and you'll soon know what works best for your brand.
The hook is what appears above the see-more cutoff, so it's the only line most readers see before deciding whether to expand. One specific tension, one surprising claim, or one number beats a vague scene-setter every time. Then keep paragraphs to one or two lines with whitespace between them. Walls of text kill dwell time, and low dwell time feeds the algorithm a negative signal.
On formatting, bolding works.
"We found that when we bold our hooks, we see like a pretty big spike in engagement rate on those posts on LinkedIn. Little tactics like that, it's interesting to see the validation for them." — Jeffrey Zhao (minute 18:30)
LinkedIn's classifiers also flag posts that pattern-match to generic AI output. Flat structure and predictable cadence suppress reach. If you're drafting with AI, edit hard for voice.
For first-time posters, the guide on writing your first post is worth ten minutes before you hit publish.
Step 3: Format Choice and What the Data Shows
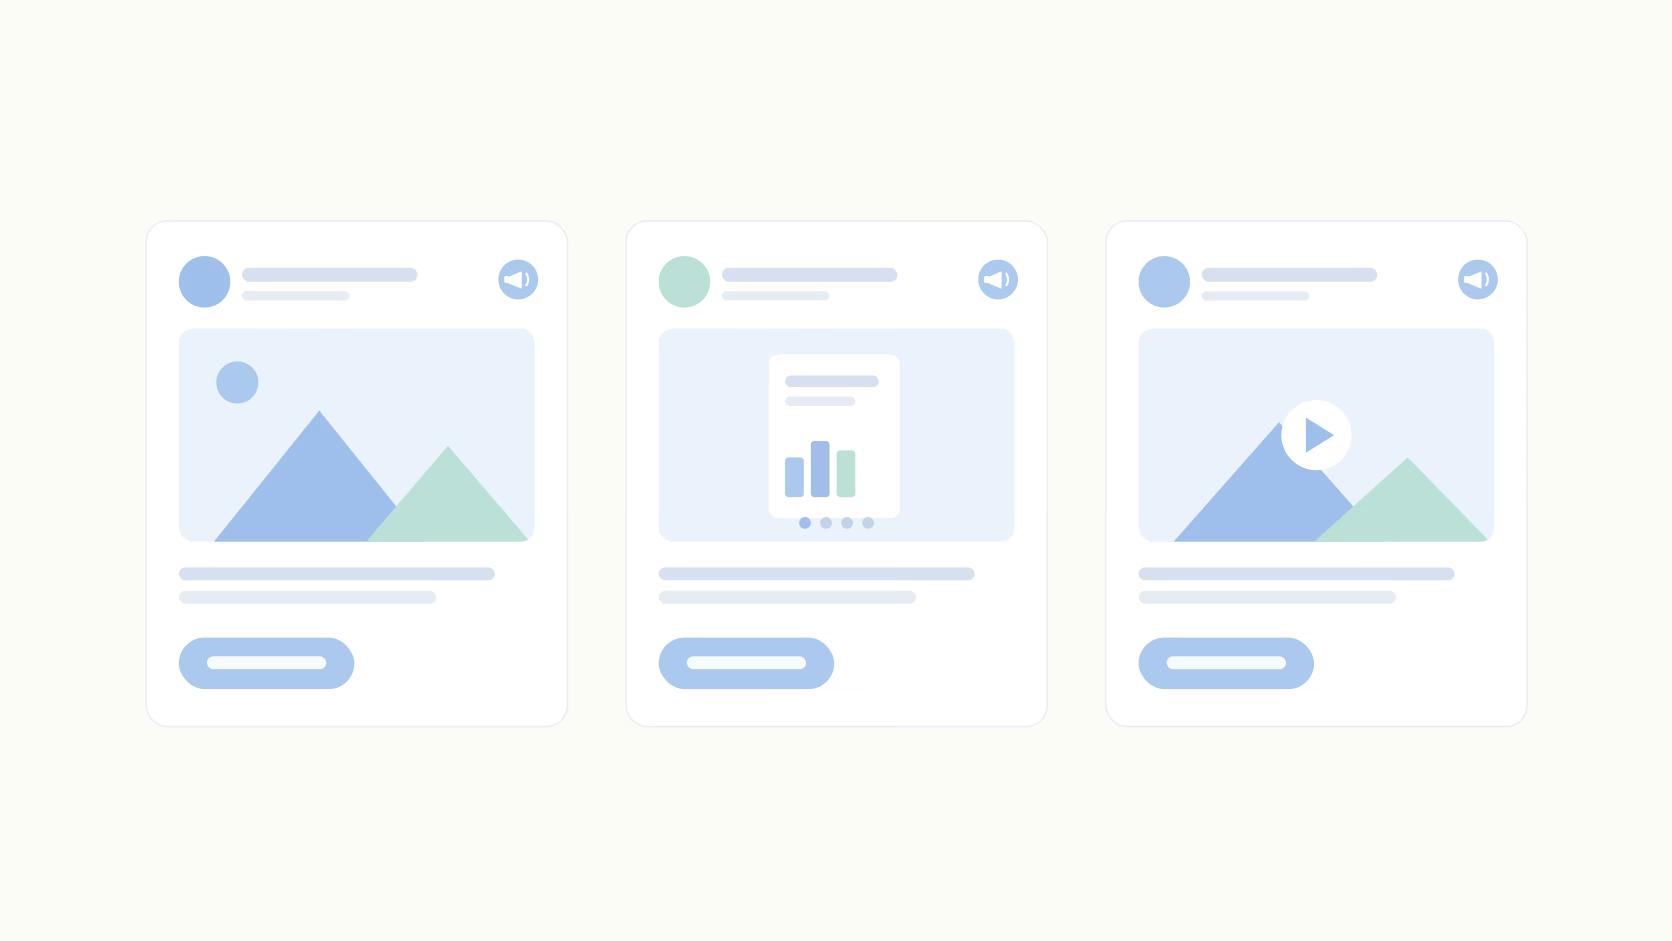
Format is more of a content decision than a production one. According to LinkedIn engagement data from Cognism (2026), posts with images get 98% more comments than posts without. That's a near-doubling from one change that takes thirty seconds.
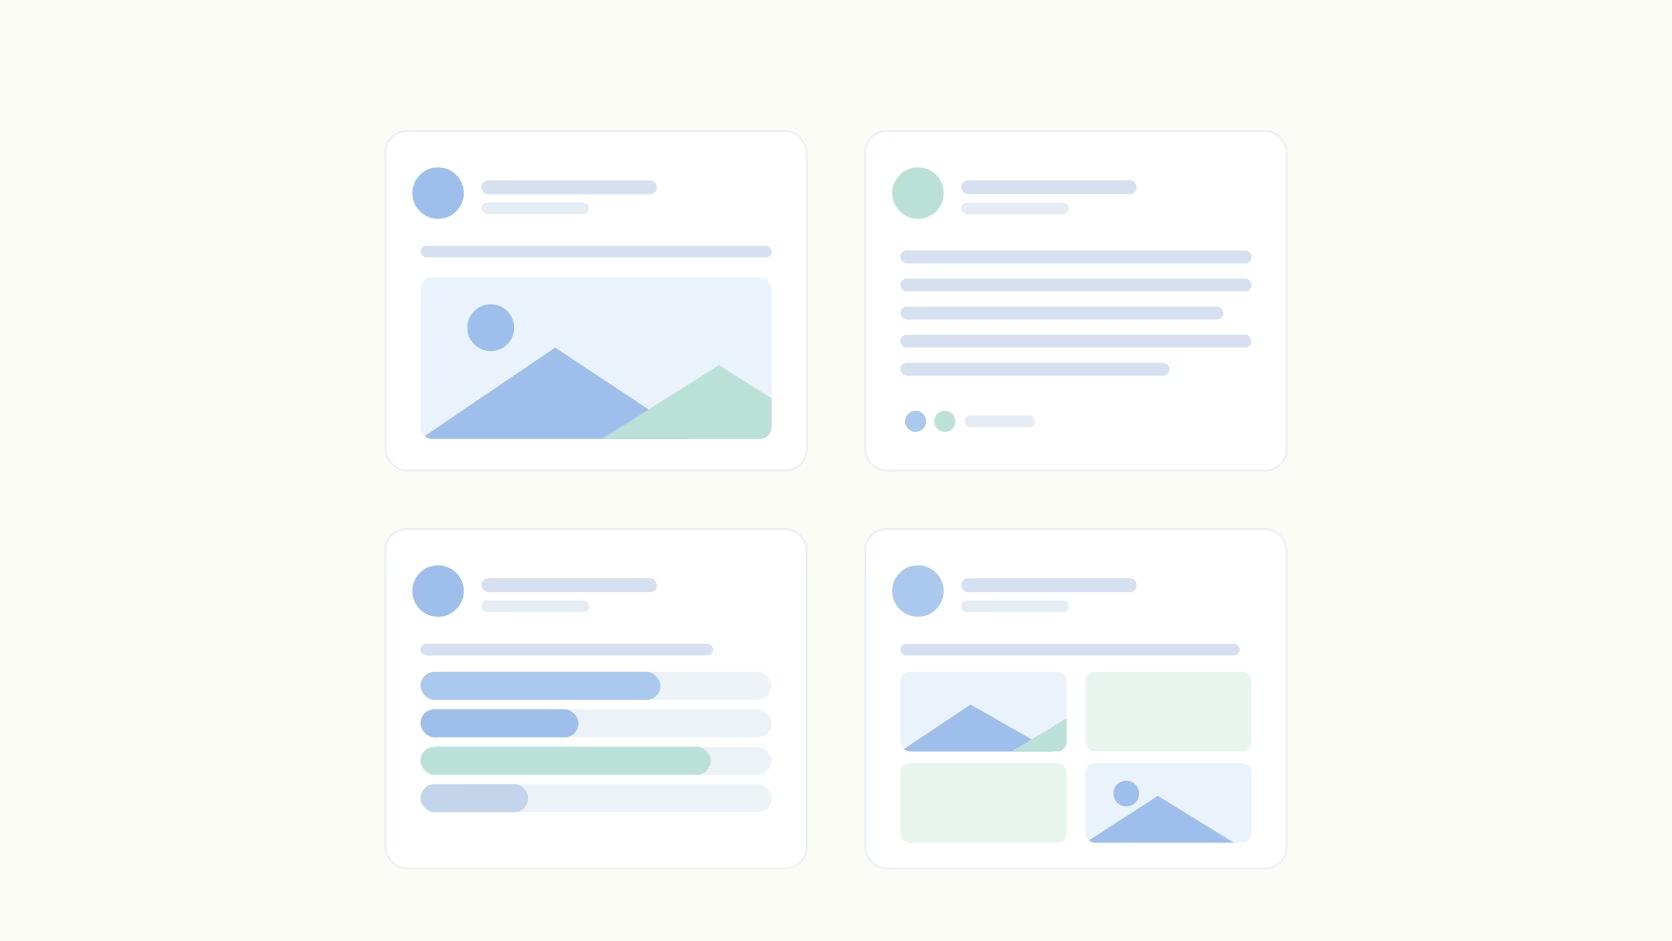
Carousels and document posts consistently beat text on engagement, especially for educational or data-heavy content where scroll-through behavior signals high dwell time. Plus, it's no secret that video is climbing fast.
Polls generate cheap early engagement, which makes them useful for priming the algorithm even when the content itself is simple.
One mechanic worth noting: Ordinal supports bold and italic formatting natively, PDF carousel uploads, and personal profile tagging, all without the Unicode workarounds most scheduling tools require. The see-more preview in the editor shows exactly where your hook gets cut, so there are no post-publish surprises.
Want to try it yourself? Check out our LinkedIn Post Formatter, a free tool you can test out today.
Step 4: Timing, Cadence, and the Link Penalty
The gap in publishing frequency by account size is wide. For most B2B teams, weekly is the realistic floor. Consistency beats intensity, and showing up every week builds algorithmic momentum that sporadic bursts don't.
Weekday mornings in your audience's time zone are a reasonable default, but your own analytics will beat any general rule within a few weeks of testing. Treat recommended posting times as a starting point.
On links: putting a URL in the body carries a reach penalty, and it's grown over time. Putting the link in the first comment is the standard workaround for posts where a click is the point.
Step 5: Post-Publish Engagement and the First Hour
This is the stage most content teams treat as optional, but it's the one that decides reach.
LinkedIn reads early engagement as a quality signal and uses it to size the next distribution round. A post that earns five thoughtful comments in the first twenty minutes gets shown to more people. A post that sits quiet for an hour gets capped, and that ceiling is very hard to raise later.
The protocol is simple: get relevant teammates to leave substantive comments within the first ten minutes, actual sentences rather than reactions. Reply to every comment that lands in the first hour, since longer replies earn more dwell time than one-word acknowledgments.
If some teammates aren't on a scheduling platform, a Slack ping with the post URL the moment it goes live works. Ordinal's auto-engagement handles this automatically: likes and comments fire from connected accounts with randomized timing so they read as organic.
For posts that matter, combine both: auto-engagement plus a manual Slack boost for people who can add a real opinion in the comments.
Step 6: Analytics and Iteration
Measuring totals tells you very little. Measuring by content bucket tells you which categories earn reach and which fill a calendar with noise. Tag posts with content labels (awareness, trust, pipeline, or whatever buckets fit your strategy), then review by label monthly. Kill the underperformers and double down on the winners. That iteration loop is what separates a system from random posting.
How to Start This Week
Pick two content buckets, commit to one post per week, and make sure at least two teammates are ready to comment within the first ten minutes of every publish. That alone puts you ahead of most accounts that post and hope.
Ordinal handles the mechanics that usually break this system: realistic see-more previews, native bold and italic formatting, personal profile tagging, auto-engagement that fires in the first-hour window, and label-based analytics so you can see which buckets are working. One platform instead of five tools stitched together with Slack pings and spreadsheets.
If that's the stack you're running now, it's worth a look at what Ordinal's LinkedIn tools replace.
Frequently Asked Questions
How often should I post on LinkedIn?
Weekly is the realistic floor for B2B teams. Pick a cadence you can sustain for three months straight before increasing it, and measure the results to find out what brings you the best results.
What type of LinkedIn post gets the most engagement?
Carousels and document posts tend to outperform plain text, and posts with images get 98% more comments than posts without. Video is growing fast, with views up 36% year over year, though format should follow your goal.
How long should a LinkedIn post be?
Post length follows a U-curve. Short posts under 150 characters and long posts between 2,000 and 3,000 characters both outperform the mid-length range, at least from what we've seen. The weakest zone sits between 600 and 1,500 characters, and it makes sense: readers either want value immediately (short posts) or they want detailed explanations for more depth (long posts). Medium posts are either too long to read with little payoff, or they don't go into enough depth to do the topic justice. That's our hypothesis, at least.
Why do my LinkedIn posts get no views?
Reach is mostly decided in the first hour. If a post doesn't earn early engagement, LinkedIn limits further distribution. External links in the post body compound the problem, so posts with no early comments and a link often stall before they get any traction.
Do personal profiles or company pages perform better on LinkedIn?
Personal profiles win by a wide margin. Our team has found personal profiles generate significantly more reach than company pages, and that gap has widened since 2024. If reach matters, post from people, not the company page.
Should I put links in my LinkedIn posts?
Links carry a reach penalty, hitting company pages hardest. Many teams put the link in the first comment to sidestep this. If the link is essential, accept that organic reach will drop, though engagement per impression can still hold up.
When is the best time to post on LinkedIn?
There's no universal magic hour. Weekday mornings in your audience's time zone are a reasonable starting point, but your own analytics will beat any general rule. Test two or three windows over a few weeks and let the engagement data decide.
Related Posts
Looking to learn more? The below posts may be helpful for you to learn more about social media and content marketing.