Your LinkedIn impressions are down 10% this quarter. Your engagement is up 13.82%. Which number goes on the board slide?
Those aren't hypothetical figures. Metricool's 2025 LinkedIn data shows a 10% drop in impressions alongside a 13.82% increase in engagement (LinkedIn impressions data, 2025) over the same period. Teams read that as a mixed quarter. It usually isn't one. The impressions vs engagement debate gets framed as a ranking question, but one metric is the denominator of the other, so they can't move independently even when your content does nothing different.
Impressions tell you how far something travelled. Engagement rate tells you whether it landed. Report either one alone and you're presenting a number that can improve specifically because performance got worse.
TLDR:
- Impressions count every time content rendered on a screen, including repeat views. Engagement counts interactions: reactions, comments, shares, and clicks.
- Engagement rate is usually engagement ÷ impressions, so falling impressions can raise engagement rate with zero improvement in the content itself.
- Ordinal's analysis of LinkedIn posts found an average of 12.4 impressions per unique viewer, which means impression counts overstate audience size by roughly.
- Formula choice swings the answer 4.7x on identical data: 1.89% median excluding clicks versus 8.89% using the mean.
- Track impressions for distribution and engagement rate for content quality, and never report one without the other.
Impressions vs Engagement: The Short Answer
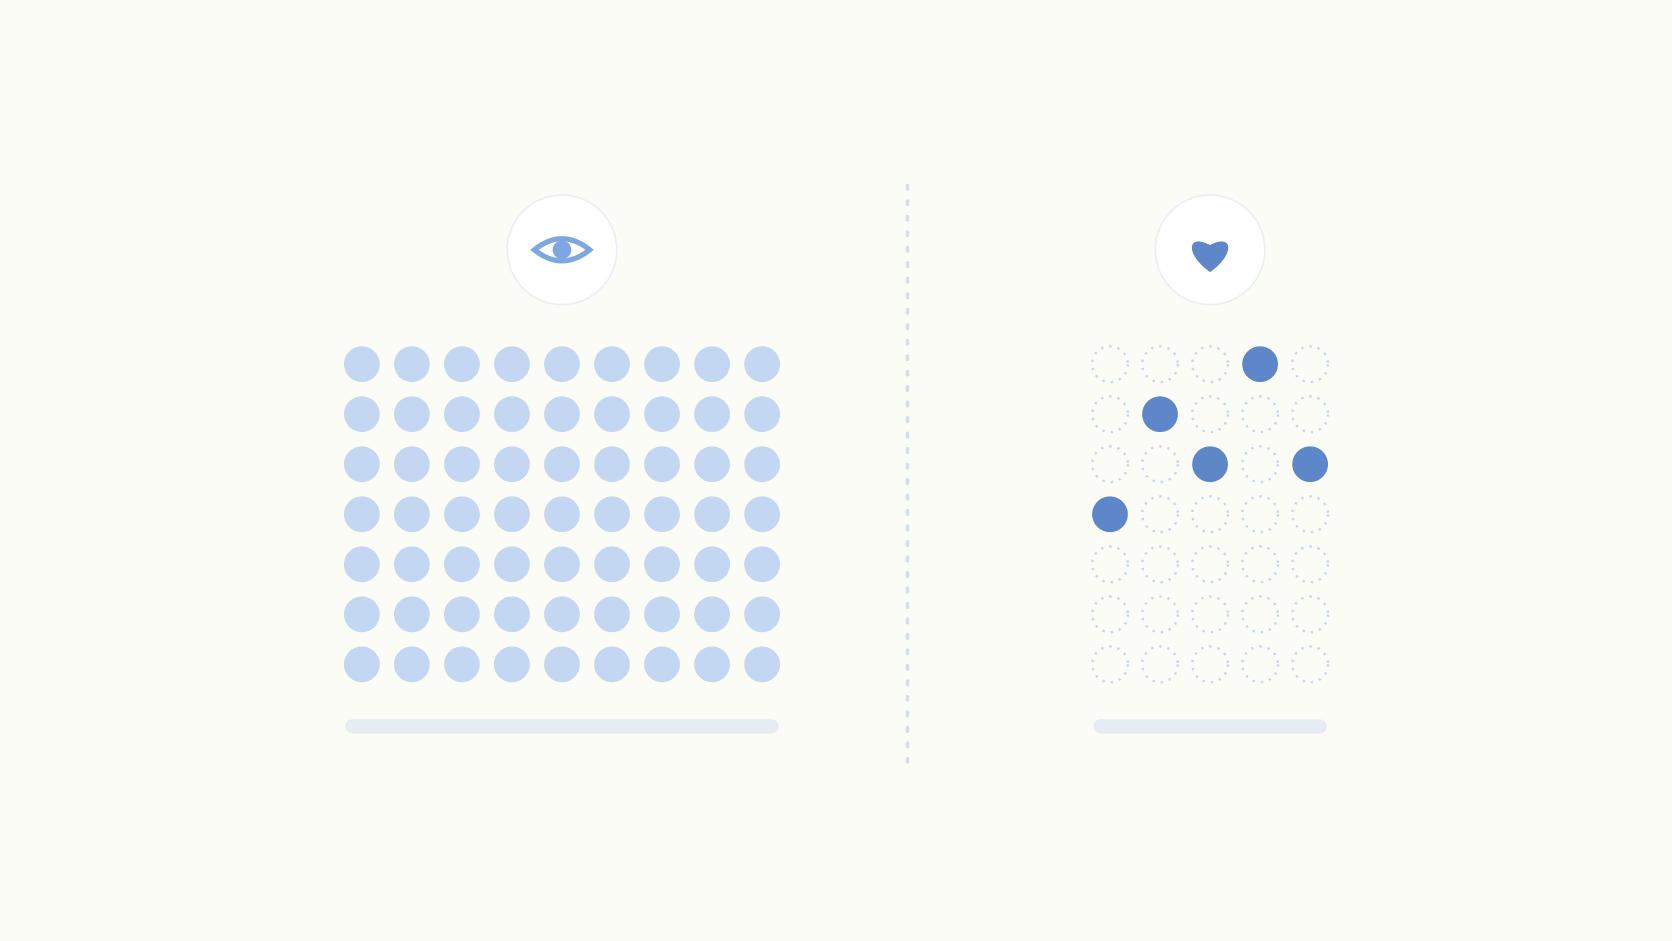
Impressions count how many times your content appeared on a screen, including repeat views by the same person. Engagement counts interactions with that content: likes, comments, shares, and clicks. Impressions measure distribution, and engagement measures whether the distribution mattered. Engagement rate divides one by the other, which is why the two numbers often move in opposite directions.
Impressions are a delivery metric. The platform decides them, you don't, and they're non-unique by design (see LinkedIn impressions explained). Engagement is behavioral: a person saw something and chose to do something about it.
The coupling is the part that trips up reporting. If impressions fall 20% and your total engagements fall 10%, your engagement rate goes up, and nothing about the content improved. It got worse and the ratio flattered it.
Why Impressions Overstate Your Audience by About
Across LinkedIn posts with both reach and impression data from 2024 onward, we found an average of 12.4 impressions per unique viewer. Same person, roughly a dozen exposures, all counted separately in the impressions column.
Run that against a real reporting number. If your quarterly deck says LinkedIn impressions, the underlying audience is somewhere near people. That's a very different conversation with a CFO, and it's exactly why impressions is the number execs anchor on: biggest and softest at the same time.
Format makes it worse. Multi-image posts in our dataset hit a impressions-to-reach ratio, so the same audience is being served that content over and over rather than the content finding new people.
The fair objection is that repeat exposure isn't worthless. Frequency drives recall, and a buyer who sees your founder twelve times is in better shape than one who sees them once. But frequency isn't audience size, and reporting it as audience size is where trust with the finance team breaks. Once someone on the exec team learns the difference between reach versus impressions, every impressions number you've ever presented gets re-read.
The Denominator Problem: How One Post Produces Three Engagement Rates
There are three denominators in common use, and each answers a different question. Impressions tells you how efficiently distribution converted into action. Reach tells you how the humans who saw it responded. Followers tells you whether your audience is still paying attention.
Here's the same post through all three. Illustrative numbers, but the shape holds on real data. A LinkedIn post gets 10,000 impressions, 1,200 unique viewers, and comes from an account with 6,000 followers. It earns 90 reactions, 20 comments, and 10 shares, so 120 engagements total.
Same post, same 120 engagements, three answers, and the highest is more than eight times the lowest.
The numerator does the same thing. Across LinkedIn posts, our median engagement rate is excluding clicks and including them, a relative jump on identical underlying data. Switch from median to mean and the same dataset reports 8.89%, which is 4.7x the conservative figure. That spread is wide enough to make any two agencies' reports incomparable, and it's why the calculate engagement rate question isn't semantic. So pick one formula, write it in the reporting doc, and don't change it mid-year. Changing the denominator in Q3 is the easiest way to manufacture a trend that doesn't exist.
None of this matters if you treat the resulting number as a scoreboard. Engagement is worth measuring because it's the first observable signal that a buyer is paying attention.
"Engagement is the top of funnel, the very very top of a conversation." — Jeffrey Zhao
What Good Looks Like: 2025-2026 Benchmarks
The median LinkedIn post-level engagement rate is, based on our analysis of posts. Above 3% is strong. Above 5% is exceptional and usually means a small, tight audience rather than a big one.
Account size changes the bar more than most teams expect: accounts under 1,000 followers post a median while accounts over 50,000 followers sit at. Engagement rate structurally declines as you grow, because the denominator grows faster than genuine interest does, so benchmarking your 40-person startup against an enterprise brand page is the wrong comparison to make. Format matters too, with multi-image posts leading at and polls trailing at.
X shows the same divergence LinkedIn does.
Average impressions per post fell 5% from 2,864.78 in 2024 to 2,711.39 in 2025, while engagement rate rose 19% from 1.32% to (X engagement benchmarks, 2025). Feeds are noisier and algorithms are filtering harder, so fewer people see each post, but the ones who do are more likely to act. Our own 2026 engagement benchmarks break the pattern down further.
Why Posting More Doesn't Fix Falling Impressions
The reflex when impressions drop is to publish more. Metricool's X dataset undercuts that directly: weekly posting volume rose 8% from 15.97 to 17.34 posts, and impressions per post still fell 5%.
Our account-level data agrees from the other side. Across roughly 3,900 LinkedIn accounts from 2024 to 2026, accounts posting 31 or more times a month reach a median 33,136 monthly impressions versus 2,564 for accounts posting 1 to 5 times. That's a real gain in total distribution. But engagement rate stays flat at around 1.9% no matter the cadence, which means volume buys distribution without buying resonance. If your engagement rate is 0.8%, posting twice as often gets you twice as much 0.8% content.
So diagnose before you adjust cadence. Low impressions with a healthy rate is a distribution problem, and the fix is frequency, format, and employee amplification. Healthy impressions with a low rate is a content problem, and posting more makes it louder rather than better.
There's a quieter lever most teams skip. When the author replies in the comments within the first hour, engagement rate lifts ( versus ), and only of posts in our dataset do it.
How to Report Both Metrics Without Losing the Room
- Pick your denominator and document it: Impressions is the safest default for B2B because both LinkedIn and X report it natively, so nobody has to reverse-engineer your math.
- Put impressions and engagement rate side by side on the same slide, every single time. A rate without a volume number is unfalsifiable.
- Use median rather than mean for post-level benchmarking, because one viral post will drag a mean into fiction.
- Segment by format and content label before you draw any conclusion, since format explains more variance than strategy does.
- Attach a dollar figure: Earned media value converts impressions into what the equivalent paid reach would have cost, which is the translation layer between a social metric and a finance conversation.
This is where tooling earns its keep. Ordinal filters analytics by post format, label, and campaign, calculates earned media value against a custom CPM per channel, and surfaces both impressions and engagement rate in the same view so the two never get separated on the way to a deck. If you're building the reporting layer from scratch, start with the metrics B2B marketers track.
What to Do Next
Pull your last quarter's posts, calculate engagement rate by impressions using the median, and segment the results by format.
Whatever you put on the slide, don't call impressions "people reached." At 12.4 impressions per unique viewer on LinkedIn, that one word costs you roughly an order of magnitude in credibility the first time someone checks.
Frequently Asked Questions
What's the Difference Between Impressions and Engagement?
Impressions count how many times content appeared on a screen, including repeat views by the same person. Engagement counts what people did with it: reactions, comments, shares, clicks. Impressions measure distribution and engagement measures response, which is why the two can move in opposite directions in the same reporting period.
Are Impressions or Engagement More Important?
Engagement rate is the better signal of content quality, and impressions is the better signal of distribution volume. If forced to pick one for an exec summary, use engagement rate with impressions as context, since engagement rate accounts for the fact that a post shown to people should out-earn one shown to 500.
What Is a Good Engagement Rate on LinkedIn?
The median LinkedIn post-level engagement rate is, based on Ordinal's analysis of posts. Anything above 3% is strong and above 5% is exceptional. Account size matters here: accounts under 1,000 followers median while accounts over 50,000 followers median.
Why Are My Impressions Dropping but Engagement Going Up?
This is common, and it usually isn't a problem. Metricool's 2025 data found LinkedIn impressions dropped 10% while engagement rose 13.82% in the same window. Feeds are getting filtered harder, so fewer people see each post, but the people who do see it are more likely to act on it.
Do Impressions Equal the Number of People Who Saw My Post?
No, and this is where most reporting goes wrong. Ordinal's analysis of LinkedIn posts found an average of 12.4 impressions per unique viewer, meaning impressions represents roughly actual people. Reach is the unique-viewer metric and impressions is the total-delivery metric.
How Do You Calculate Engagement Rate From Impressions?
Divide total engagements by total impressions and multiply by 100. A post with 120 engagements and 10,000 impressions has a 1.2% engagement rate by impressions. Including link clicks in the numerator changes the answer a lot: it raises Ordinal's LinkedIn median from 1.89% to 2.96%.
Should I Post More Often to Increase Impressions?
More posting does raise total impressions. Ordinal's account-level data shows accounts posting 31+ times a month reach a median monthly impressions versus for accounts posting 1 to 5 times. Engagement rate holds flat around 1.9% regardless of cadence, so volume buys distribution without improving how well any single post lands.
Are Impressions a Vanity Metric?
Impressions turn into a vanity metric the moment they get reported as audience size, which they aren't. Used correctly, they tell you whether distribution is growing and give you a denominator for engagement rate. Used incorrectly, they inflate a board slide by roughly on LinkedIn.
Related Posts
Looking to learn more? The below posts may be helpful for you to learn more about social media and content marketing.