A LinkedIn company page posting three times a week publishes about 13 posts in a calendar month. If one of those posts significantly outperforms your median impressions, your monthly engagement rate jumps, and you'll spend the next stakeholder meeting explaining a trend that doesn't exist. The reporting period for social media determines whether the number at the top of your report reflects performance or calendar mechanics.
Teams default to the calendar month because it matches payroll and the finance close, not because 30 days is the right window for the question being asked. And once you've inherited that template, nobody (usually) re-examines it.
TLDR:
- Match the reporting period to your posting volume rather than the calendar. Fewer than 20 posts in a window means you're reading noise.
- Use rolling 28-day windows instead of calendar months for month-over-month comparisons, because calendar months contain 4 or 5 weekends and that alone moves B2B engagement rates.
- Run a layered system: weekly tactical (team only), monthly rolling-28 (stakeholders), quarterly (execs and strategy), and annual (board).
- Build in a data lag buffer, since pulling a report the morning after the period closes undercounts the last few days of impressions on most platforms.
- Never compare a period to the one immediately before it without also checking the same period last year.
What Is a Reporting Period for Social Media?
A reporting period for social media is the fixed date range you pull performance data from, commonly 7, 28, 30, or 90 days, and against which all period-over-period comparisons are made. It defines both what gets counted and what your changes are measured against.
The term gets confused with attribution window constantly, and that confusion produces double-counted numbers. The reporting period is the window you measure. The attribution window is how long after publication a post keeps getting credit for downstream results.
Every period decision also contains a structural choice most teams never make consciously: fixed calendar (January 1 to 31) or rolling (the last 28 days from today). Those two produce different numbers from identical data.
This matters more in B2B than in consumer social because posting volume is lower. A consumer brand publishing 60 times a month has a sample large enough to absorb an outlier. A B2B SaaS page publishing 13 times doesn't.
Which Reporting Period Should You Use?
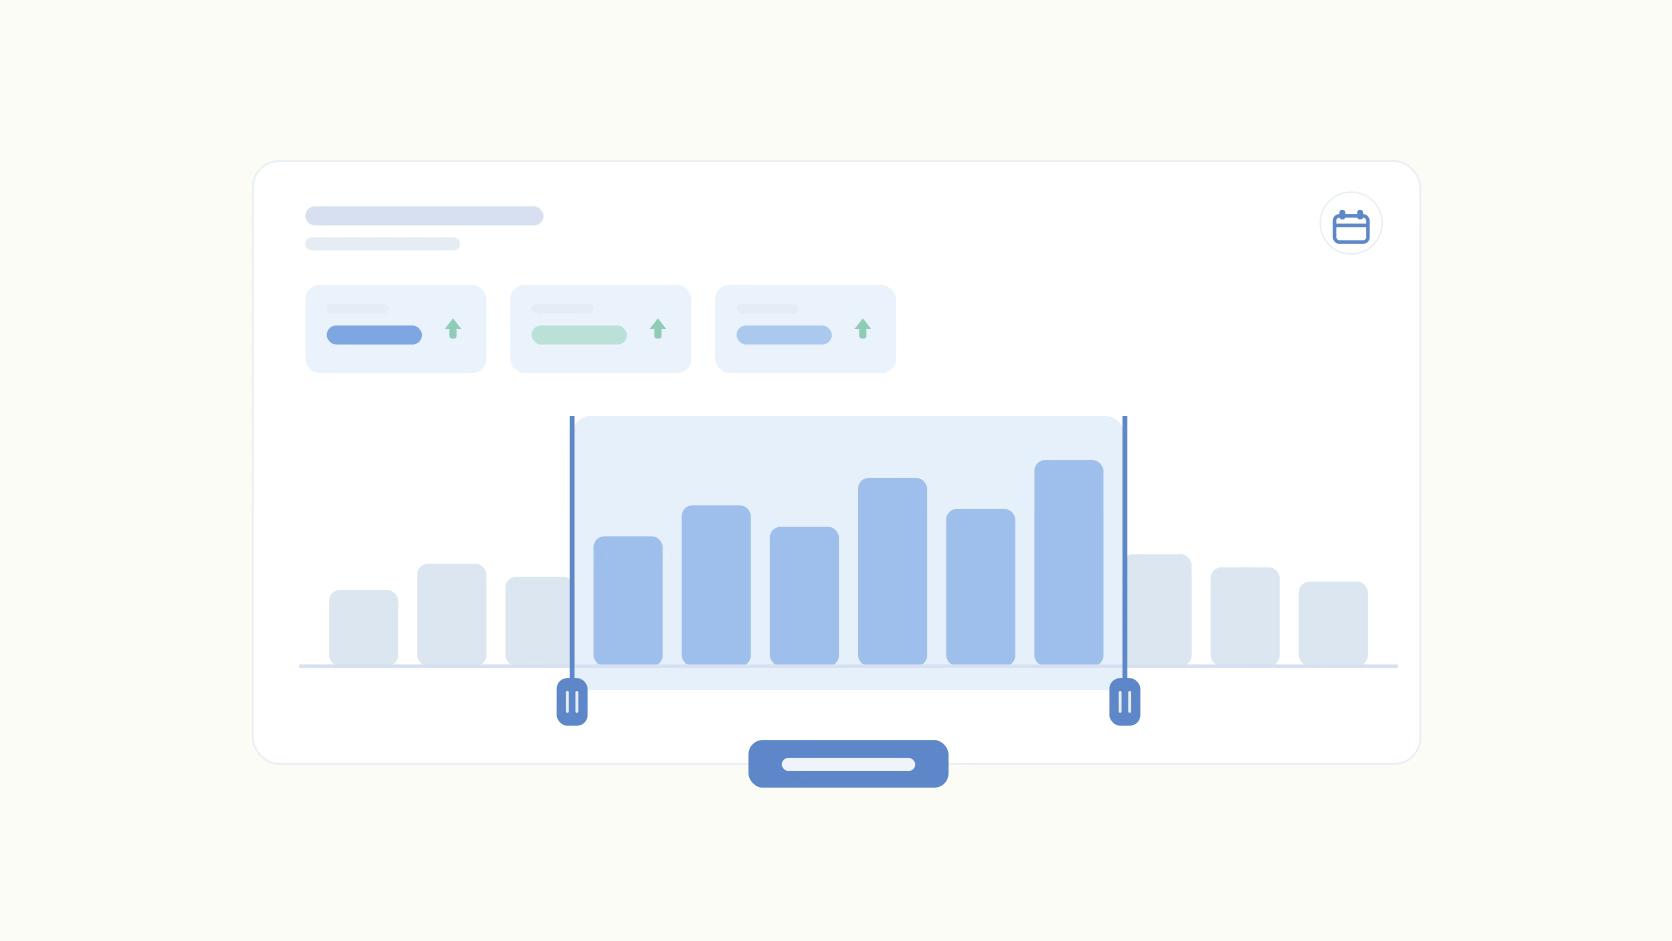
For most B2B teams, a rolling 28-day period is the right default for stakeholder reporting, a rolling 7-day period for internal tactical review, and 90 days for anything strategic. The deciding variable is post volume. You need roughly 20 to 30 posts inside a window before period-over-period comparisons carry signal instead of noise.
Here's the arithmetic, and this worked example is illustrative rather than research.
A team posting 3x/week on LinkedIn publishes 12 posts in a 28-day window. Eleven of them average 800 impressions and one hits 6,400, so total impressions land at 15,200 with a median of 800. Now move that single outlier into the next 28-day window. The two periods swing from 15,200 to 8,800, a 42% drop, with nothing about the content or the audience having changed.
At 3x/week you need roughly a 90-day window and 36 posts before one post stops driving the headline number.
If your volume sits below the threshold for the cadence you want, you have two honest options: lengthen the period, or report cumulative and rolling metrics instead of period-over-period deltas.
Reporting a delta you can't defend is worse than reporting no delta at all.
The Layered Reporting System: Four Periods, Four Audiences
Treating the reporting period as a single choice is the mistake underneath most social media reporting cadence problems. The right setup runs four periods concurrently, each with its own KPI set and its own reader.
The weekly layer is tactical and internal. Post-level performance, which hooks landed, which formats underperformed. Nobody outside the social team should see it. Its job is to change next week's calendar rather than to prove ROI.
The monthly layer is the one that gets circulated. Rolling 28 days, engagement rate, follower delta, top posts, and earned media value. Since the typical social user visits 6.5 different platforms each month (platform usage data, DataReportal, 2026), this layer should be cross-channel or it'll misrepresent where your audience is.
The quarterly social media report is where content bucket performance and channel mix live, because 90 days is the first window long enough for content-category comparisons to be valid.
Annual is trajectory, total EMV, and share of voice for the board.
The obvious objection is fair: that's four reports and nobody has time for four reports. But it's one dataset with four saved views, and the work happens once when you set the filters.
A well-built social media analytics dashboard means the quarterly report is the monthly report with a different date range and filter set, not a rebuild.
Why Calendar Months Break Your Comparisons
Calendar months are the worst available default for B2B social reporting, and almost everyone uses them.
Start with length.
February runs 28 days and January runs 31, a meaningful swing in the size of the measurement window itself before anything else varies. If you post on a fixed weekly cadence, that's roughly one extra post in January for structural reasons alone.
Weekend count is the bigger problem and the one nobody catches. A calendar month contains either 4 or 5 weekends, so a 5-weekend month has 2 fewer weekdays than a 4-weekend month of the same length. For a LinkedIn-heavy program where weekday impressions carry the account, that's two missing business days of distribution, and in a 13-post month, two posting days is 15% of your output.
Then the outlier problem compounds it. A post published on the 30th gets one day of impression accrual inside the reporting period and 13 days outside it. The same post published on the 3rd gets counted almost in full.
The fix is a rolling 28-day window.
Every 28-day window contains exactly 4 weekends and 20 weekdays, every time, so the container stops varying and comparisons become apples-to-apples. This is the single change that does the most for MoM credibility.
The tradeoff is real and worth conceding out loud. Finance works in calendar months, fiscal quarters don't line up with rolling windows, and a CFO asking why the social number doesn't tie to the month-end close is a conversation you'll lose. So report the rolling 28-day figure as the primary comparison and list the calendar-month figure alongside it. Two columns, one argument.
There's a second reason not to trust a stale baseline. The global social user base grew 4.8% in the 12 months to October 2025, adding 259 million new identities to reach 5.66 billion (global social media data, DataReportal, 2026). The population underneath your numbers moves fast enough that a year-old baseline is a different audience.
Data Lag and Attribution Windows
Two mechanics distort period-based social reports. Platform data lag means impressions and engagements keep accruing for days after a post publishes, so a report pulled the moment the period closes undercounts the final days. Attribution windows determine how long a post keeps getting credit for downstream results, which can cause the same conversion to land in two consecutive periods.
On data lag, the practical fix is a buffer. Pull on the 4th for a period ending on the last day of the prior month, or pick any consistent offset and never move it, because a consistent offset makes the lag cancel out across comparisons.
On attribution, state the rule plainly: keep the attribution window shorter than or equal to the reporting period, or de-dupe explicitly. A 30-day attribution window paired with a 28-day reporting period will double-count.
Platforms also restate metrics retroactively when they filter spam and bot engagement, which means a number you reported last month may not match the same query today. Snapshot the data at pull time and report from the snapshot rather than a live query. For the deeper periodic review that sits above routine reporting, a full social media audit is the right instrument.
How to Set Up Your Reporting Periods in Five Steps
- Count your posts: Pull the last 90 days and count posts per channel. That number is your floor, and under roughly 20 posts per window you lengthen the period.
- Pick your primary window: Rolling 28-day for most B2B teams. Rolling 7-day only if you're publishing daily across multiple channels.
- Set your pull date and never move it: Same offset from period close, every single time, because inconsistent pull timing is indistinguishable from a performance change in your data.
- Define two comparison baselines: Every headline metric gets the previous period and the same period last year. One number alone can't separate a trend from a season.
- Assign KPIs per layer: Weekly gets post-level metrics, monthly gets rate metrics and EMV, quarterly gets content-bucket and channel-mix analysis. Don't let executive KPIs leak into the weekly report, and don't let a generic social media report template dictate which metrics belong where.
Ordinal's analytics views can be saved and filtered by date range, label, and campaign, so the four layers become four saved views instead of four manual exports.
Final Thoughts
Change three things in your next stakeholder report. Switch the primary comparison from calendar month to rolling 28 days, add a fixed pull buffer of a few days after period close, and add a year-over-year column next to your period-over-period column.
Open last month's report today and count how many posts sit inside the window. If the number is under 20, lengthen the period before you send another one.
Frequently Asked Questions
What Is a Reporting Period for Social Media?
A reporting period for social media is the fixed date range you pull performance data from and measure every comparison against, usually 7, 28, 30, 90, or 365 days. It's distinct from the attribution window, which is how long a post keeps getting credited with results after it publishes.
How Often Should I Report on Social Media?
Weekly for the internal team, a rolling 28-day window for stakeholders, and quarterly for anything strategic. The right cadence depends on posting volume, so a team posting daily can support weekly reporting while a team posting twice a week should lengthen the window instead.
What Is a 28-Day Reporting Period and Why Use It Instead of a Calendar Month?
A rolling 28-day period always contains exactly four weekends and 20 weekdays, so it isn't distorted by the fact that calendar months run anywhere from 28 to 31 days with 4 or 5 weekends. The tradeoff is that a rolling window won't tie to a fiscal quarter, so finance-facing reports may still need the calendar-month figure alongside it.
What's the Difference Between a Reporting Period and an Attribution Window?
The reporting period is the window you're measuring inside. The attribution window is how long after a post publishes you keep crediting it with likes, comments, or conversions. If your attribution window is longer than your reporting period, the same result can show up in two consecutive reports.
How Many Posts Do I Need Before a Reporting Period Gives Reliable Data?
Roughly 20 to 30 posts inside the window before period-over-period comparisons carry real signal. Below that, one outlier post can swing your headline engagement rate with zero underlying change in performance, so lengthen the period or report cumulative totals instead of deltas.
Should I Compare Month Over Month or Year Over Year?
Both, and neither alone is enough. Month-over-month catches recent shifts in performance, while year-over-year controls for seasonality, since the social media reporting period you choose can still hide a seasonal pattern.
When Should I Pull My Social Media Report After the Period Ends?
Build in a buffer of a few days so posts from the final days of the period finish accruing impressions before you pull the numbers. The exact length matters less than consistency: use the same offset every time, or your data lag becomes indistinguishable from an actual performance change.
Can I Use Different Reporting Periods for Different Platforms?
Yes, and you often should, since posting volume varies by channel. Keep the window consistent within each individual channel, and label the difference clearly so nobody compares a 7-day LinkedIn number to a 28-day X number.
Related Posts
Looking to learn more? The below posts may be helpful for you to learn more about social media and content marketing.