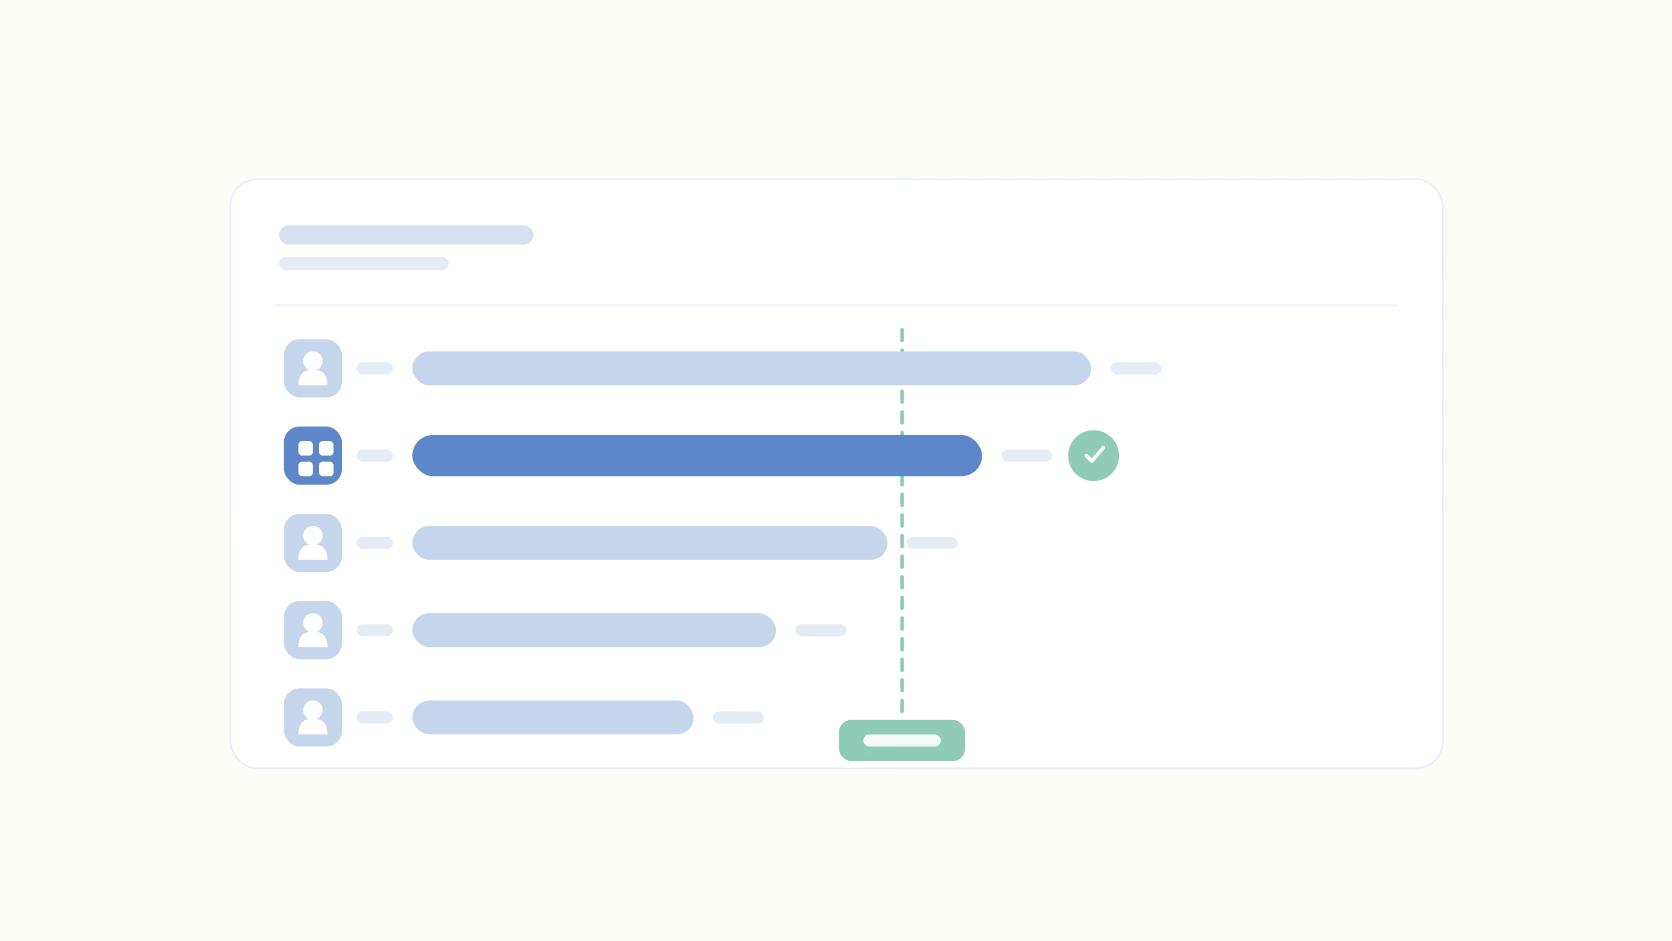
Toyota scored 83 on the 2026 American Customer Satisfaction Index. Subaru scored 81, and the industry aggregate was 80 (The American Customer Satisfaction Index, 2026). Same question, same scale, same denominator, three points of spread. That's a benchmark doing its job.
But LinkedIn engagement rate doesn't work that way.
And that's why most competitor benchmark sets end up pointing at the wrong asset entirely. We've found company pages average a 1.56% engagement rate against 0.91% for personal profiles. But personal profiles produced 1.22 billion impressions in that same dataset, against 162.5 million for company pages. So the metric on your benchmark slide crowns the surface responsible for roughly 12% of total reach.
TLDR:
- Engagement rate is a denominator trap. Company pages "beat" personal profiles 1.56% to 0.91% while personal profiles delivered 7.5x the impressions
- The two competitor benchmarks worth building are posting surface (who publishes) and format mix (what they publish), because that's where the real spreads live
- Format spread inside a single account dwarfs any competitor-to-competitor gap: shorts hit 5.40% engagement, thought leadership 0.64%
- Pick competitors on stage, time in market, and go-to-market motion before category. Five to seven, not twenty
- If a metric can't move in response to a decision you make this quarter, it's context rather than a benchmark
What Are Competitor Benchmarks?
A competitor benchmark is a specific, measurable performance figure taken from a comparable competitor or a defined peer set, used as a reference point for your own performance on the same metric, measured the same way. It answers "where do we stand" with a number instead of a feeling.
That's not the same thing as competitor analysis, which is the qualitative read on positioning, messaging, and strategy. Benchmarks are the numeric layer sitting inside that broader work.
There are two shapes:
- Single-competitor benchmarks pit you against one named rival, and they're the more actionable version when you genuinely lose deals to that company
- Cohort benchmarks compare you to the median of a peer set, and they're far more stable
Use the median, not the average. One competitor with an eleven-year head start drags an average hard enough to make the whole set useless.
Why Most Benchmark Sets Compare the Wrong Things
The standard approach picks competitors by category and metrics by whatever the tool exports. Both choices are wrong. And they're wrong in the specific way that produces a slide which survives the meeting and changes nothing.
Category is the laziest matching criterion available. A Series A company benchmarking against a public competitor in the same category is comparing itself to a different business with a different cost of capital and a sales team ten times the size.
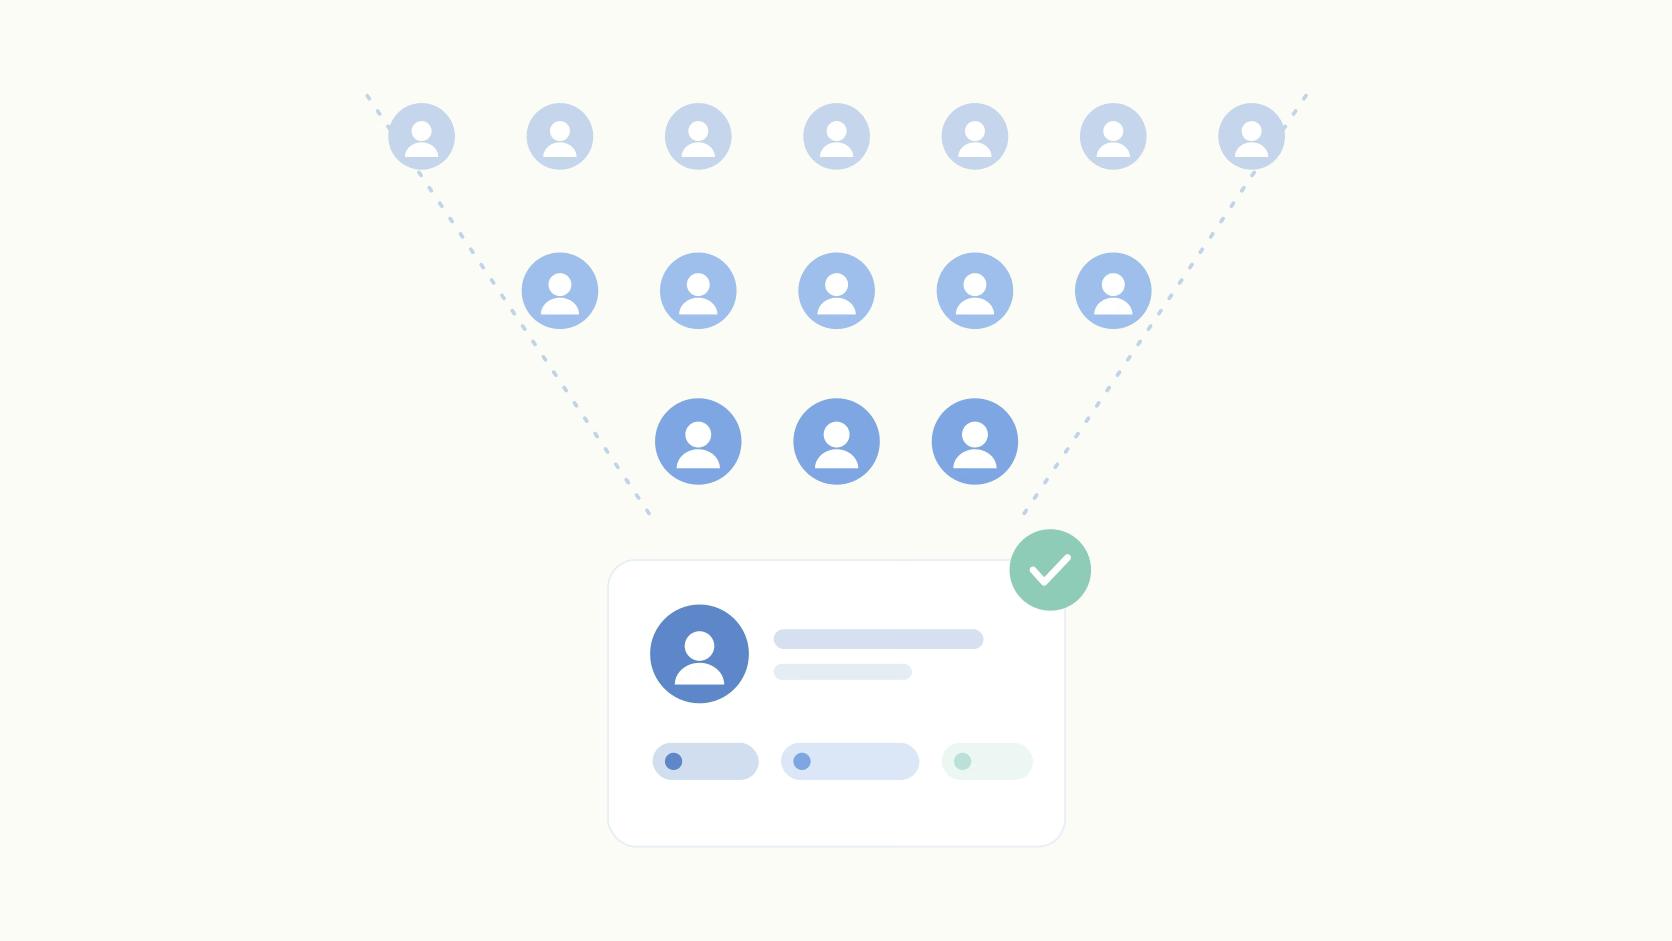
Three filters matter more: company stage and headcount, time in market, and go-to-market motion. Product-led and sales-led companies produce completely different content profiles. Benchmark one against the other and you learn about their funnel rather than strategy for your execution.
Then there's controllability: follower count, total ARR, and headline revenue growth are outcomes of years of compounding, and the bar itself moves for reasons that have nothing to do with your team. Elevated Signal's 2026 benchmark compilation puts average SaaS revenue growth at 26%, with the top quartile sliding from 60% in 2023 to roughly 50% in 2025. Benchmark against last year's leader number and you've quietly set yourself up to miss a target the market already lowered.
If a metric can't visibly move in response to something your team decides this quarter, it belongs in the context column (not the benchmark column).
"But leadership asks for follower count." Fine. Report it, and report it next to a metric that responds, like posting cadence or per-post engagement. Just don't manage to it.
And the gaps are usually tighter than anyone assumes. Three ACSI points separate the strongest automaker from the middle of the field. Teams routinely assume a competitor is miles ahead when the real difference is that the competitor showed up more consistently.
How to Build a Competitor Benchmark Set
- Define the peer set: Five to seven competitors, filtered on stage, market, and GTM motion before category. Split them into two tiers: direct rivals you lose deals to, and aspirational peers two or three years ahead. Benchmark against tier one and watch tier two.
- Pick four to six metrics that pass the controllability test: For each candidate, ask whether a different quarter of execution would visibly move the number. If the honest answer is no, it's context.
- Choose a data source per metric and write it down: Source consistency beats source sophistication, because switching tools in month seven makes your trend line meaningless. For competitor posting history on X, Twitter Advanced Search with a date range gets you cadence for free.
- Calculate every gap as a ratio: Say you post 12 times a month averaging 340 engagements per post, and your closest comparable competitor posts 20 times averaging 290. Your per-post engagement is 17% higher, but their monthly total is 5,800 against your 4,080, so they're 42% ahead on volume of engagement. The gap is cadence rather than craft, and that's a finding someone can act on Monday. "They get more engagement" isn't. (Illustrative figures.)
- Set a target and a re-check date in the same sentence: "Close the per-post engagement gap to within 10% of the peer median by June 30" is a benchmark target, while "improve engagement" is a wish.
Step three is where most sets quietly die. So here's where the data lives if you aren't buying an enterprise intelligence suite.
Which Metrics to Benchmark (And Where the Data Lives)
Five metrics are worth benchmarking for a B2B marketing team: posting cadence, engagement rate, share of voice, follower growth rate, and content format mix. Each has a public or semi-public data trail.
Each responds to a decision you can make inside a quarter.
Two of those deserve most of your attention. The spreads are enormous and the data is free.
Surface split is the share of a competitor's reach coming from personal profiles versus their company page. Reconstruct it by listing their founder, CEO, and five most active employees, then tallying posts and visible reactions across 30 days alongside the company page's. If a competitor's founder is visible and yours isn't, that's the gap. No amount of company page posting closes it.
Format mix is the second, and the internal spread is larger than any competitor-to-competitor delta you'll ever measure. Counting a competitor's last 30 posts by format takes fifteen minutes and tells you more than a quarter of follower tracking.
One hard rule: never benchmark engagement rates across platforms.
A 2026 Emplifi study of social media benchmarks found TikTok generated twice the median interactions of Instagram and 20x more than Facebook, which means platform choice sets the ceiling before content quality enters the conversation. Median SaaS retention benchmarks sit at 102% net revenue retention and 90% gross revenue retention (Elevated Signal, 2026). Your social numbers get read against those whether you include them or not.
Where Competitor Benchmarking Goes Wrong
Benchmarking to the category leader instead of the peer median is the most common error. The leader is an outlier with structural advantages you can't buy this year. The median is the number that tells you if you're behind.
Stale data presented as current is the second. A figure pulled in January and shown in June is a historical artifact. Date-stamp every number on the slide.
Third is measuring whatever exports cleanly, which hands your strategy over to a tool's default settings. And sometimes a gap isn't a problem at all. If a competitor is winning on a channel you deliberately walked away from, note it in one line and move on.
The failure we'd flag hardest is benchmarking too often. Monthly re-benchmarking on low-volume metrics manufactures narrative out of randomness, and the predictable result is a team spending Q2 chasing a competitor's lucky March. Quarterly is the right call for most metrics. Monthly only where the post volume is high enough for signal to beat noise.
Tracking Benchmarks Without a Manual Spreadsheet
The framework above usually dies in month three. Somebody has to pull all of it by hand, and that somebody has a day job.
Ordinal handles your side of the comparison: analytics with label filtering and earned media value, so you can segment performance by content category and compare like-for-like across quarters instead of eyeballing a follower chart. API and MCP access means the data flows into whatever dashboard the benchmark set already lives in.
Final Thoughts
The value of a benchmark set is decided at the peer-selection step, before anyone pulls a single number. Get the comparability wrong and every figure downstream is precise and meaningless.
So this week: name your five comparable competitors on stage, time in market, and GTM motion. Pick four metrics that pass the controllability test, and make surface split and format mix two of them. Source each one, write down where it came from, and put a re-check date on the calendar for the last week of the quarter.
That set will do more for your planning than any tool you buy to build it.
Frequently Asked Questions
What Are Competitor Benchmarks?
A competitor benchmark is a specific performance figure from a comparable competitor, used as a reference point for the same metric on your side. Competitive analysis is the qualitative read on positioning and messaging, while competitor benchmarks are the hard numbers that either support that read or contradict it.
How Do You Choose Which Competitors to Benchmark Against?
Filter on stage, time in market, and go-to-market motion before you filter on category. Five to seven competitors is the working range, split into two tiers: direct rivals you lose deals to, which you benchmark against, and aspirational peers a few years ahead, which you watch but don't measure against.
What Metrics Should Be Included in a Competitor Benchmark Set?
Five metrics cover most B2B marketing teams: posting cadence, engagement rate, share of voice, follower growth rate, and content format mix. Run each candidate through one test, asking whether a different quarter of execution would visibly move the number. Financial context like median SaaS net revenue retention (102% per Elevated Signal, 2026) belongs in the same deck even when marketing doesn't own it.
How Often Should You Update Competitor Benchmarks?
Quarterly for most metrics, monthly only for high-volume ones like posting cadence where there's enough data to separate signal from noise. Monthly re-benchmarking on low-volume metrics manufactures a story out of randomness, and a single good week for a competitor isn't a trend.
Where Can I Get Competitor Benchmark Data for Free?
Native platform pages, published industry benchmark reports, competitor blogs and newsrooms, and job postings all work without paying for an intelligence suite. Job postings in particular reveal headcount shifts and priority bets months before they show up anywhere else.
What's the Difference Between Competitor Benchmarking and Competitive Analysis?
Competitor benchmarking is the numeric layer: a specific metric with a specific figure attached to it. Competitive analysis is the broader qualitative read on a rival's positioning, messaging, and strategy, with benchmarking sitting inside it as the part you can put a number on.
Is It Worth Benchmarking Against the Market Leader?
Not as your primary target. The leader is usually an outlier with structural advantages, like more funding or more years in market, that your team can't replicate this quarter. Benchmark against the peer median instead, and track the leader separately as directional context.
Why Do Competitor Benchmarks So Often Fail to Change Anything?
Two reasons show up again and again. The peer set wasn't comparable, so the gap it revealed wasn't real, or the metrics chosen couldn't respond to any decision the team could make in a quarter. Fix the peer-selection step first, and everything downstream gets easier.
Related Posts
Looking to learn more? The below posts may be helpful for you to learn more about social media and content marketing.