

Ordinal analyzed 87,528 Twitter/X posts published from January 2024 through May 2026. Here's what the numbers say about engagement, format, timing, and post length, plus how to read your own analytics with those benchmarks in mind.
TL;DR
- Threads average a 1.89% engagement rate, nearly 3x plain text and 3.5x video
- Thursday is the highest-engagement day at 1.08%; the common "post on Tuesday" advice doesn't hold in this dataset
- 100–200 character posts win on engagement (1.09%), while posts under 100 characters get more impressions
- Text-only posts average 35,975 impressions vs. 18,334 for media posts, but media converts harder at 0.79% vs. 0.68%
- Overall median engagement rate is around 0.70%; anything above 1% is strong
What Twitter Analytics Shows You in 2026
Twitter Analytics (now X Analytics) is the platform's built-in performance dashboard at analytics.x.com. It tracks impressions, engagements, engagement rate, profile visits, link clicks, and video views at the post level. The mobile app surfaces the same data under "View post analytics" on any individual post.
With 251 million daily monetizable users as of Q1 2026 (X platform statistics, Digital Applied), the platform isn't going away. But the native dashboard has real limits. Account-level analytics now sit behind the X Premium paywall.
If you want audience demographics or historical data beyond 28 days, you need a subscription.
Read the full breakdown on whether X Premium is worth it before making that call.
What the native dashboard doesn't show: content category performance, cross-account comparison, or any sense of how your formats stack up against a benchmark. For spot-checks it's fine. For strategy, it isn't enough.
The Twitter/X Metrics That Matter
Engagement rate is more useful than raw impressions right now. According to Metricool's X engagement data, average retweets per post jumped 35% year-over-year (from 4.93 to 6.67) while average impressions per post fell 5%. Those two numbers moving in opposite directions tell you the platform is getting noisier on reach but stickier on sharing behavior.
You need to track engagement rate because iompressions alone won't tell you if your content is landing. For context on how impressions are counted across reposts and quote tweets, that distinction matters more than most guides acknowledge.
Also, bookmark count is underrated. A bookmark means someone saved your post to return to it, which is high-intent behavior that feeds directly into engagement rate in X's calculation. Profile visits are similarly useful: when a post drives someone to your profile, they're considering following you or researching your brand. Both are worth tracking weekly.
What to ignore: follower count in isolation, and impressions on one-off viral posts. Both look good and tell you almost nothing about whether your content strategy is working.
2026 Twitter Engagement Benchmarks
Ordinal analyzed 87,528 Twitter/X posts published from January 2024 through May 2026. Engagement rate is defined as (likes + retweets + replies + bookmarks) / impressions. Posts with zero impressions were excluded.
Engagement Rate by Post Format
Threads have the highest engagement rate on X at 1.89%, nearly 3x plain text and 3.5x video.
- Thread: 1.89% engagement, 27,508 avg. impressions
- Image/GIF: 0.99% engagement, 13,053 avg. impressions
- Poll: 0.89% engagement, 3,634 avg. impressions
- Carousel: 0.72% engagement, 12,335 avg. impressions
- Link: 0.68% engagement, 9,573 avg. impressions
- Text: 0.67% engagement, 46,731 avg. impressions
- Video: 0.53% engagement, 30,684 avg. impressions

The video finding is worth sitting with. Video posts average 30,684 impressions, the second-highest reach of any format, yet the engagement rate is dead last at 0.53%. People scroll through video on X. They interact with threads.
For B2B teams optimizing toward engagement, threads are the highest-leverage format in this dataset.
Engagement Rate by Day of Week
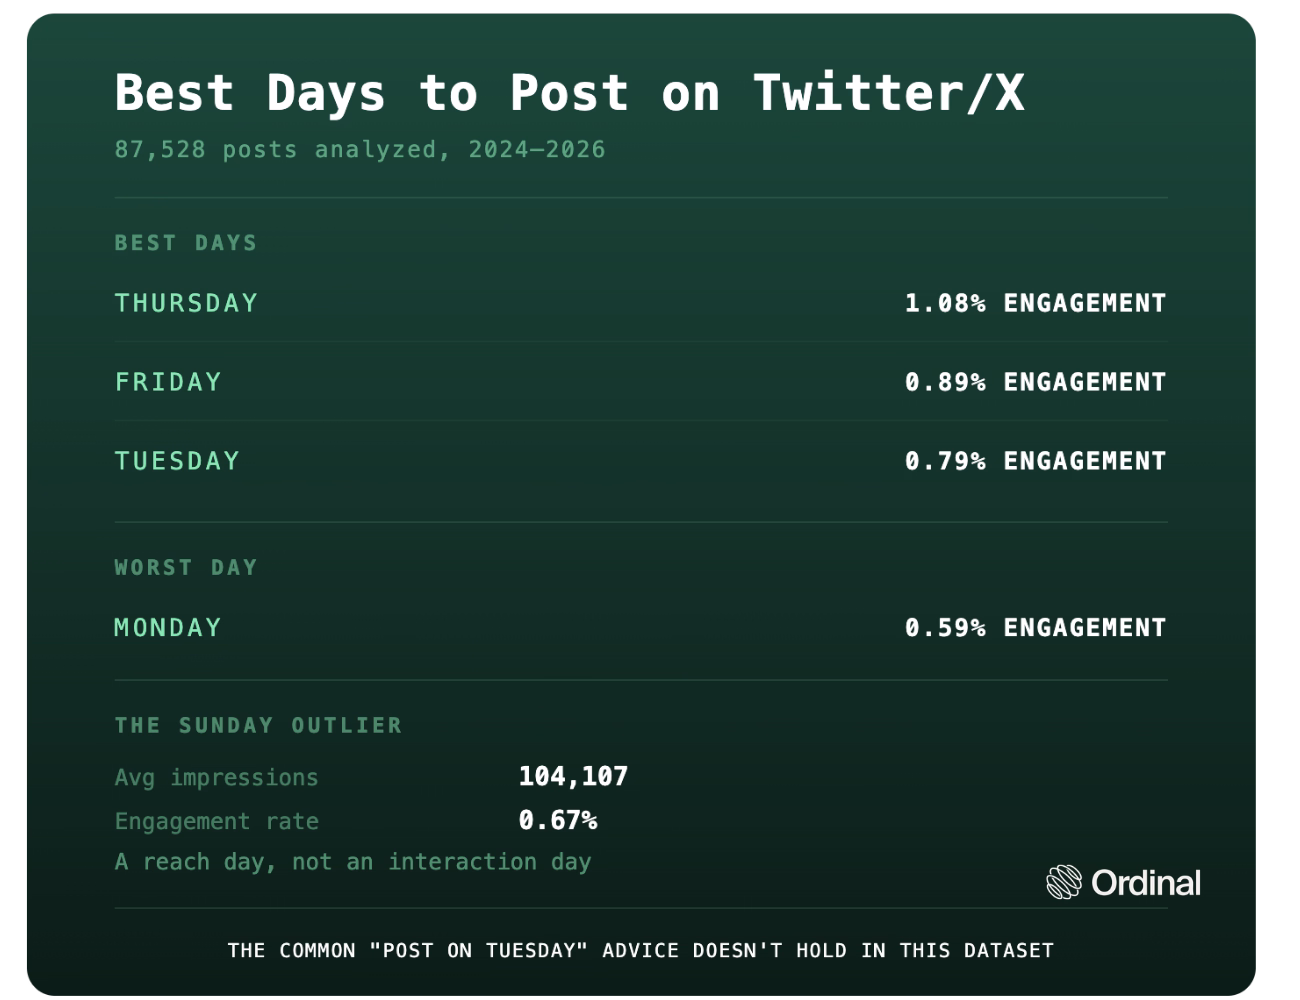
Thursday wins at 1.08%, followed by Friday at 0.89%. The common advice to post on Tuesday doesn't hold here. Tuesday comes in at 0.79%, and Monday is the weakest weekday at 0.59%.
Sunday is the outlier worth noting: 104,107 average impressions, by far the highest of any day, but only a 0.67% engagement rate. Sunday is a reach day, not an interaction day. For more on how timing interacts with day-of-week effects, see our guide on best times to post on X.
Engagement Rate by Post Length
Posts between 100 and 200 characters hit the highest engagement rate at 1.09%. Posts under 100 characters generate the most impressions (67,356 on average) but engage at only 0.68%. Going over 280 characters holds up at 0.74%, better than the 200–280 range (0.63%), but also only available for Premium users (free users are capped at 280 characters).
Short posts travel. Medium posts convert. If you're writing for engagement, aim for 100–200 characters. If you're writing for reach, keep it under 100.
Media vs. Text-Only

Media posts average 0.79% engagement vs. 0.68% for text-only, a real but modest gap. The more striking difference is impressions: text-only posts average 35,975 vs. 18,334 for media. This means that text reaches further, but m,edia converts harder.
Which one you prioritize depends on whether you're optimizing for depth or width in any given week.
Sprout Social's data puts overall X engagement up 19% year-over-year, with average likes at 32.89 per post. That directionally matches our dataset: the platform's passive audience is shrinking while its engaged core is more active.
How to Read Your Own Twitter Analytics
Pull your engagement rate first. Not impressions, not follower count. At least not first.
Then segment by format. If you've been posting mostly video and wondering why performance feels flat, the benchmark explains it: video averages 0.53% in this dataset, while threads hit 1.89%. That gap isn't random variation.
Three things to check weekly: your engagement rate against the 0.70% median, profile visits (a proxy for brand interest that spikes after posts that land), and which format drove your top-performing post. Most accounts have enough data to spot a pattern within four to six weeks of consistent posting.
One common misread: don't let a single viral post anchor your expectations.
A text post that catches a trending topic can hit 200,000 impressions while your average sits at 15,000. That outlier tells you almost nothing about your baseline. Strip it from your averages before drawing conclusions.
Where Native Analytics Falls Short
The native dashboard doesn't support content category tagging, so there's no way to see whether your "product update" posts outperform your "industry take" posts without tracking it manually. No cross-platform comparison, no earned media value calculation, and historical data cuts off at 28 days without a Premium subscription.
For teams that need more, Twitter analytics in Ordinal pulls and stores your X data daily, lets you filter by content label or format, and calculates earned media value so you can tie X performance to actual dollar figures.
For deeper search-based research, Twitter Advanced Search and X Radar for trend tracking fill gaps the analytics dashboard can't. Teams that have put these together, like how Gallery scaled content, have seen measurable gains in both volume and performance.
What to Do With This Data
The platform has shifted from mass reach to high-intent interaction. Passive viewers are leaving. Engaged followers are staying and sharing more. Your analytics approach needs to account for that shift: weight engagement rate over impressions and treat format selection as a strategic variable, not a stylistic one.
Three metrics worth tracking every week: engagement rate (benchmark: 0.70% median, 1%+ is strong), profile visits after each post, and which format is driving your best results. Everything else can be reviewed monthly.
Threads on Thursdays, in the 100–200 character range, is where this dataset points. Whether that holds for your specific audience is something only your own data can answer. But that's the baseline to test against.
Frequently Asked Questions
Is Twitter Analytics Free in 2026?
Basic post-level analytics are free for any X account. Account-level analytics, including audience demographics and longer historical windows, require X Premium starting at $8/month. If you need more depth, third-party tools like Twitter analytics in Ordinal pull and store your X data independently of the paywall.
Why Can't I See My Twitter Analytics?
The most common reasons: you're on a brand-new account (X requires posting history before enabling analytics), you're checking on mobile where the view is limited, or you don't have X Premium for account-level data. Try visiting analytics.x.com on desktop while logged in.
What Is a Good Engagement Rate on X in 2026?
Based on 87,528 posts from January 2024 through May 2026, the overall median engagement rate is around 0.70%. Anything above 1% is strong. Threads average 1.89%, image posts 0.99%, and video 0.53%. Your benchmark depends on format and audience size.
How Is Engagement Rate Calculated on X?
(Likes + retweets + replies + bookmarks) divided by impressions. X's native dashboard calculates this automatically per post. Some third-party tools include or exclude bookmarks differently, so check the definition when comparing numbers across platforms.
What's the Best Day to Post on Twitter for Engagement?
Thursday has the highest engagement rate at 1.08%, followed by Friday at 0.89%. Sunday produces the highest average impressions (104,107) but middling engagement, making it better for reach than interaction. For more detail, see our guide on the best times to post on X.
Why Are My Impressions Dropping Even Though Engagement Is Up?
This is platform-wide. Average impressions per post fell roughly 5% year-over-year while engagement metrics rose 19% (Metricool, 2025). X is shedding passive viewers and retaining active ones. Lower impressions with a higher engagement rate is a healthier signal than the reverse.
Should I Track Video Performance Differently Than Text Posts?
Yes. Video has the lowest engagement rate in this dataset at 0.53%, despite averaging 30,684 impressions per post. Track video by views, completion rate, and profile visits rather than engagement rate. Threads and text posts should be judged primarily on engagement rate and replies.
Related Posts
Looking to learn more? The below posts may be helpful for you to learn more about social media and content marketing.