
Almost every "best time to post" article on the internet traces back to the same recycled charts. No sample size, no statistical testing, and no way to tell whether the data applies to a B2B SaaS company or a beauty brand.
We analyzed 434,639 posts published since 2024 across LinkedIn and Twitter/X. Engagement rate throughout means likes + comments + shares + saves + sends divided by impressions, excluding clicks. We ran a Welch's t-test on weekday versus weekend performance. The findings contradict most of what you've read.
TL;DR
- Friday leads LinkedIn engagement rate at 1.08%, followed by Tuesday at 1.07%. Not Wednesday, which most charts recommend.
- Best UTC hours for LinkedIn: 10:00 (1.34%), 08:00 and 11:00 (both 1.31%)
- Thursday leads Twitter/X at 1.20%. Monday is worst at 0.60%.
- Weekday posts outperform weekends per-post: 7.12% vs. 5.12% engagement rate (p < 0.001 across 434,639 posts)
- Sunday gets the most impressions on LinkedIn (6,905 per post) but not the strongest engagement rate. That distinction matters for how the algorithm treats your next post.
Why Posting Time Affects Reach
LinkedIn's algorithm in 2026 depends on early engagement velocity. When you publish, the algorithm shows your post to a small initial sample, then measures how quickly likes, comments, and shares accumulate in the first 60 minutes. Strong early signals trigger broader distribution. Weak signals and the post stalls.
Bad timing makes this worse.
Post at 17:00 UTC and you're competing against hundreds of other posts hitting the feed at the same time, many from larger accounts with bigger engagement networks. Your post gets the same initial sample, but fewer of those people are in a commenting mood at the end of their workday.
There's also a gap between "when your audience is online" and "when they engage." Sunday LinkedIn traffic is real, but Sunday LinkedIn engagement is weaker. High impressions with a low engagement rate actually hurts you in subsequent algorithmic rounds, because the algorithm reads a low ratio as a signal the content isn't landing.
Best Times to Post on LinkedIn

The best days to post on LinkedIn are Friday and Tuesday, with peak hours at 10:00, 08:00, and 11:00 UTC. This comes from 256,356 LinkedIn posts published since 2024 up to this week in 2026.
Friday leads the week at 1.08% engagement rate. Tuesday is close at 1.07%. Thursday, which many charts treat as a safe B2B posting day, has the lowest engagement rate at 0.88%.
That's a 20-basis-point gap between the best and worst weekdays, and it compounds across dozens of posts per month.
The hourly data is just as counterintuitive.
10:00 UTC leads at 1.34%, with 08:00 and 11:00 UTC tied at 1.31%. These windows hit early-to-mid morning in European business hours and pre-meeting hours on the US East Coast. For a deeper LinkedIn timing breakdown with platform-specific nuance, we've covered this separately.
Hootsuite's 2025 analysis of best cross-platform posting times puts LinkedIn's strongest windows at Tuesdays and Wednesdays from 4 to 6 AM local time, which aligns directionally with our early-morning UTC finding.
But the Sunday paradox is worth calling out.
Sunday posts average 6,905 impressions per post, the highest of any day. But the engagement rate is only 0.98%. Fewer people post on Sundays, so individual posts get more feed real estate, but the people scrolling are less likely to stop and engage. For algorithmic purposes, that's a bad trade.
Best times to Post on Twitter/X
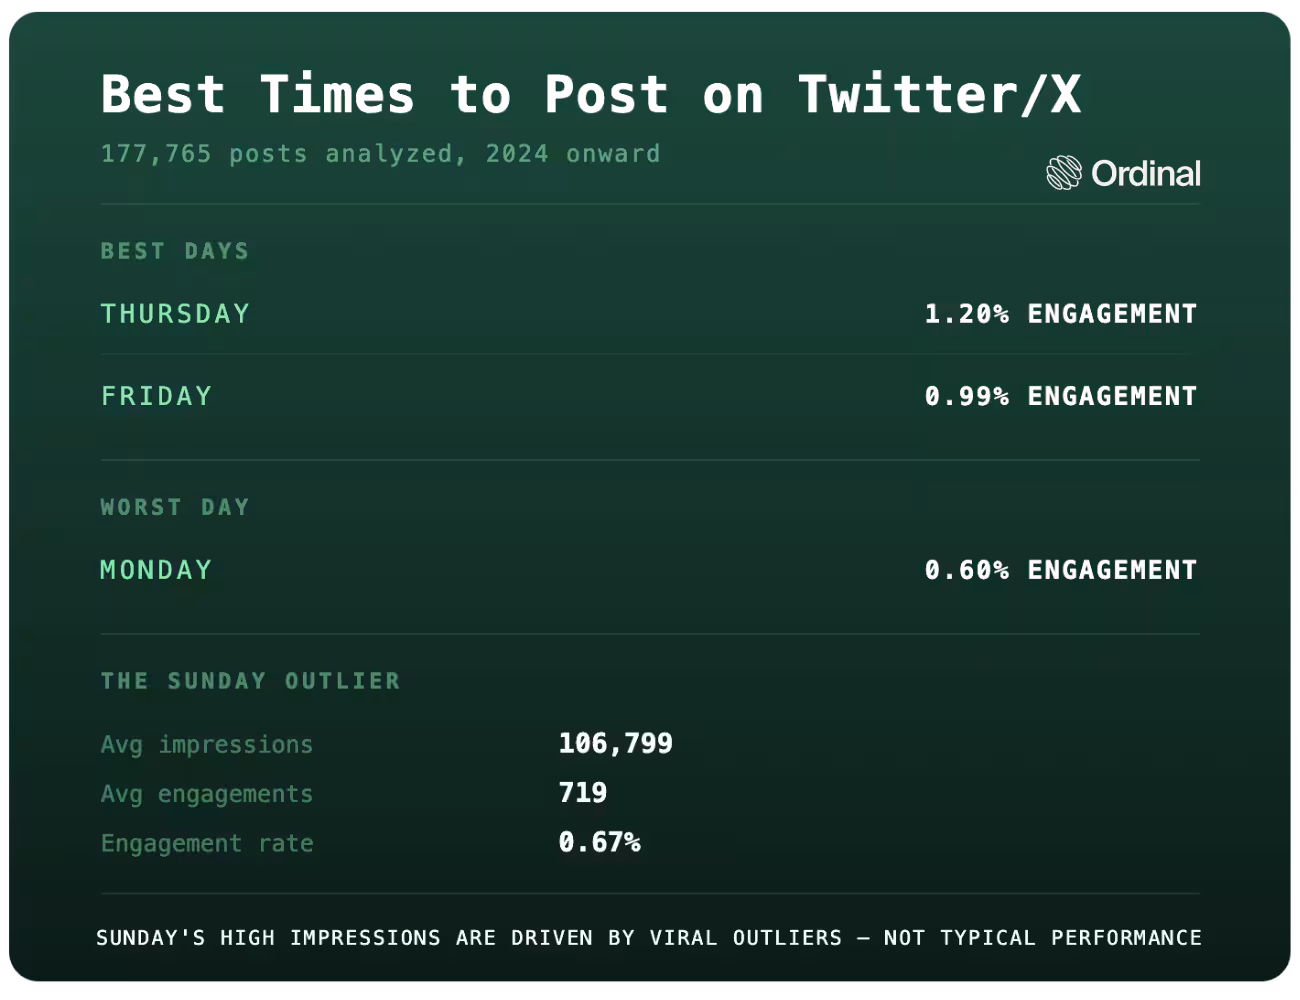
Thursday leads Twitter/X at 1.20% engagement rate across 177,765 posts. Friday is close behind at 0.99%.
For hourly breakdowns, our Twitter/X timing data lives in a separate post.
Monday is the worst day by a wide margin at 0.60%, half of Thursday's figure. The likely explanation: Monday's feed is crowded with brand and publisher content kicking off the week, which compresses visibility for everyone else.
Sunday on Twitter/X tells a similar story to LinkedIn, but more extreme.
Sunday posts average 106,799 impressions and 719 engagements, both far above any other day. But the engagement rate is only 0.67%. Those Sunday numbers are almost certainly driven by a small number of viral outlier posts pulling the average up, which is why engagement rate is a more honest metric than raw counts for most accounts.
Best Times to Post on Other Platforms

For Instagram, our Instagram posting times guide covers this in detail.
The short version: midweek afternoons. Wednesday tends to outperform, with engagement picking up between late morning and early evening.
TikTok follows a different pattern. Based on a TikTok timing analysis of 50,000 accounts by SocialPilot (2026), the strongest windows are 10 AM to 12 PM, 2 to 4 PM, and 6 to 10 PM midweek. Content on TikTok gets re-evaluated and redistributed throughout the day, so timing works less like a single lever and more like a series of on-ramps.
Facebook is the most straightforward. Buffer's 2026 analysis found weekdays between 8 AM and noon perform best, with Mondays from 12 to 1 PM and Tuesdays through Wednesdays from 12 to 8 PM leading the week. Weekends drop off sharply, consistent with the weekday dominance we see across every platform.
Weekday vs. Weekend: What the Statistical Test Shows
Across 434,639 posts on LinkedIn, Facebook, Instagram, and Twitter/X, weekday posts outperform weekend posts on a per-post basis. The numbers: 7.12% average engagement rate on weekdays versus 5.12% on weekends. Welch's t-test: t-statistic of 10.433, p < 0.001.
But there's definitely nuance here. On a weighted total-engagement basis, weekends actually edge out weekdays slightly (1.371% vs. 1.319%). Weekend posts collectively convert impressions at a marginally higher rate, but the typical individual weekday post performs better. For most accounts posting at normal frequency, the per-post figure is what matters.
The practical takeaway is that weekdays for your regular cadence. Don't write off weekends entirely if your audience scrolls on Saturdays, but don't expect a weekend post to rescue a struggling content calendar either.
Worst Times to Post
On LinkedIn, 17:00 UTC delivers the lowest engagement rate at 0.70% despite having the highest average impressions per post (8,410).
The feed is crowded, scroll behavior turns passive at the end of the workday, and competition for attention is at its peak. Early morning hours (03:00 and 04:00 UTC) show a similar pattern: decent impressions, weak engagement, because the audience online at those hours tends to scroll without stopping.
On Twitter/X, Monday at 0.60% is the clear outlier. Any window with high impressions and low engagement is worse for your algorithm momentum than a quieter window with stronger engagement, because platforms use the ratio to decide how much distribution your next post gets.
How to Find Your Own Best Time to Post
These benchmarks are a starting point. Friday at 1.08% and Thursday's Twitter/X peak are real signals from 434,639 posts, but your audience isn't the average of every B2B account in the dataset. Timezone, content type, and posting frequency all shift the optimal window.
Our posting frequency data shows how cadence interacts with timing in ways aggregate benchmarks miss.
The test worth running: pick two posting windows you haven't tried, schedule consistently into each for four weeks, and compare engagement rates rather than raw impression counts. Use a scheduling and analytics platform that filters by day, hour, and content type so you're not doing this in a spreadsheet.
The teams that get this right aren't doing anything exotic. They're auditing what they've already posted, finding the patterns, and adjusting (for example, Clay grew to 120K followers in a year through exactly that kind of iteration, not a lucky post at the right moment).
Frequently asked questions
What's the single best time to post on social media in 2026?
There isn't one. Based on 434,639 posts, Friday leads LinkedIn at 1.08% engagement rate while Thursday tops Twitter/X at 1.20%. The right window for your account depends on audience timezone and content type, so treat these as a starting point and test with your own data.
Does posting time affect reach?
Yes. LinkedIn's algorithm evaluates engagement velocity in the first 60 minutes after a post goes live, then uses those early signals to decide whether to distribute it more widely. Posting when your audience is both online and likely to engage gives you a stronger signal than posting at a quieter hour.
Are weekdays better than weekends?
On a per-post basis, yes. Weekday posts average 7.12% engagement versus 5.12% on weekends across 434,639 posts, a statistically significant difference (p < 0.001). That said, weekends aren't dead if your audience is active then.
What are the best times to post on LinkedIn for B2B?
Friday and Tuesday lead at 1.08% and 1.07% engagement rate across 256,356 posts. Best hours are 10:00, 08:00, and 11:00 UTC. For US audiences, that's early-to-mid morning Eastern, before the first meetings of the day.
Why does Sunday get high LinkedIn impressions but low engagement?
Sunday posts average 6,905 impressions but only 0.98% engagement rate. Fewer people post on Sundays, so each post gets more feed real estate, but the people scrolling are less inclined to engage. High impressions with low engagement hurts your algorithmic standing on subsequent posts.
What are the worst times to post?
On LinkedIn, 17:00 UTC delivers 0.70% engagement despite the highest average impressions (8,410). The feed is too crowded and attention is too passive. On Twitter/X, Monday is the weakest day at 0.60%.
How do I find my best posting time?
Audit your last 90 days of posts filtered by day, hour, and content type. Look for the combinations with the highest engagement rate, not just the highest impressions. Then test two or three new windows for a month and compare.
Are these times the same across industries?
No. This dataset skews toward B2B LinkedIn and Twitter/X accounts, so it reflects professional rhythms. A consumer brand on Instagram or TikTok will see different patterns. Use these as a starting point and validate with your own data.
Related Posts
Looking to learn more? The below posts may be helpful for you to learn more about social media and content marketing.