Ordinal Data Lab is a series where we dig into our dataset of millions of social media posts to answer the questions marketers actually care about. Just data, no guesswork.
TL;DR: Key findings from 900,000+ LinkedIn posts
- Posts with links get 26.5% less reach on average than posts without links
- The penalty has grown from 5% in 2023 to 42% in 2025
- The reach difference is statistically significant every year (p < 0.001)
- Link posts get 22% higher engagement per impression, partially offsetting the reach loss
- Company pages are hit harder than personal profiles, which show almost no penalty
- Link-in-comments is directionally positive but not conclusive due to selection bias
Every few months, someone publishes a study on whether LinkedIn penalizes posts with external links. They analyze a few posts and draw sweeping conclusions.
We took a different approach. We analyzed over 900,000 LinkedIn posts published via Ordinal between February 2023 and February 2026. And the answer to "does LinkedIn penalize links?" is clear.
Yes. And it's getting worse.
The reach penalty is real, and it's accelerating
To measure the impact of links on reach, we indexed the data so that if link posts and no-link posts got identical reach, they'd both score 100. When the "No link" line is at 120 and the "With link" line is at 80, that means no-link posts are getting 50% more reach than link posts that period.
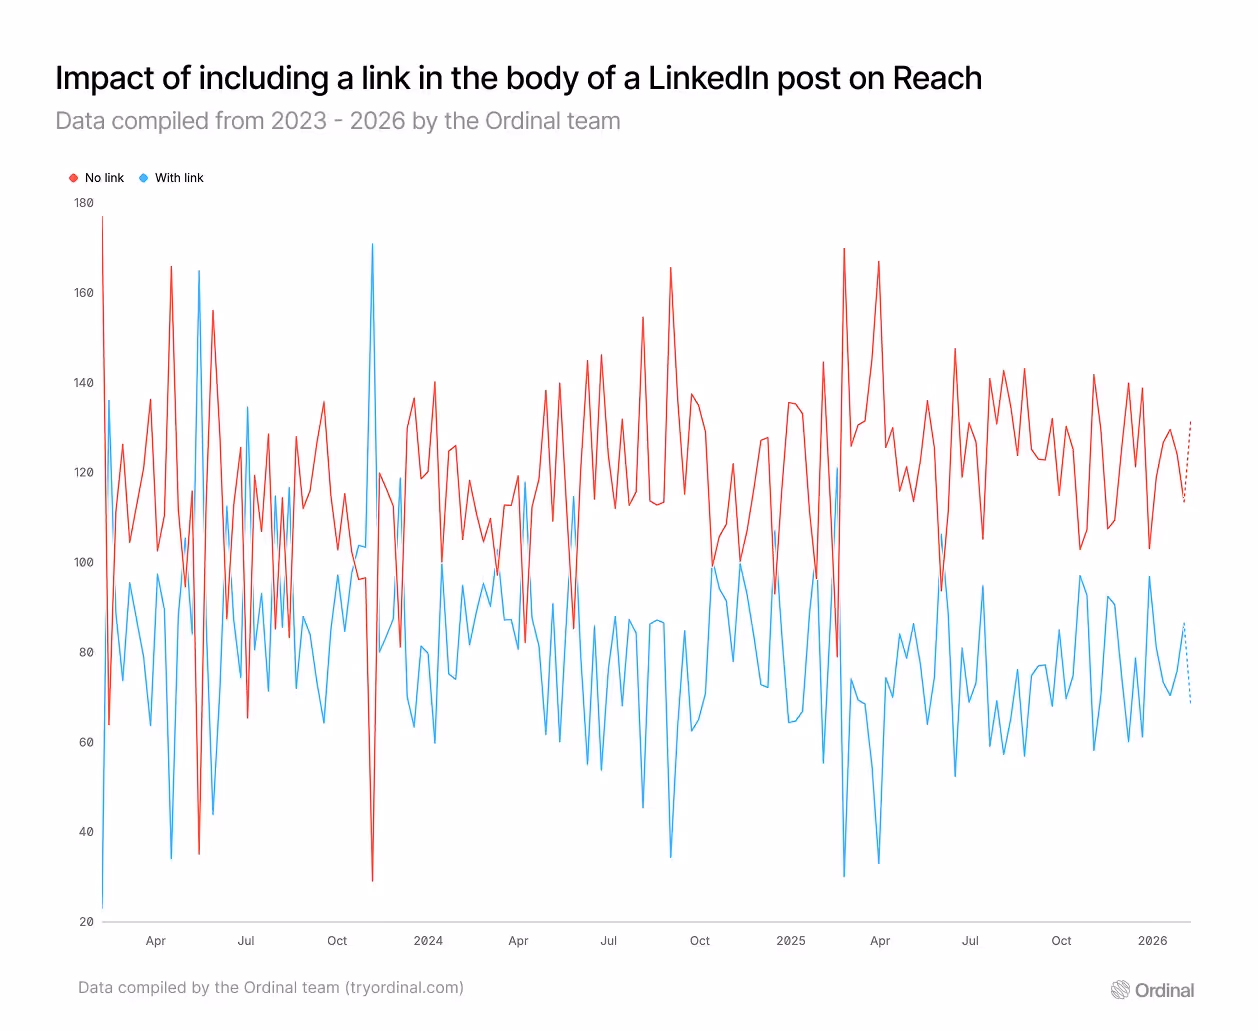
To quantify this, we also indexed reach on a monthly basis, setting no-link posts to a flat baseline of 100 each month and measuring link-post reach relative to that. Across the full dataset, posts containing external links averaged a score of 73.5. That's a 26.5% reach penalty compared to posts without links.
The penalty has grown year over year, and the difference is statistically significant in every period (Mann-Whitney U test, p < 0.001):
- 2023: Score of 94.8 (a modest 5% penalty)
- 2024: Score of 64.9 (a 35% penalty, 95% CI: 20%-48%)
- 2025: Score of 58.4 (a 42% penalty, 95% CI: 35%-48%)
- 2026 YTD: Score of 62.1 (a 38% penalty, 95% CI: 28%-46%, two months of data)
In 34 out of 37 months we measured, link posts scored below the no-link baseline. The worst month was September 2024, when the score hit 33.4. Posts with links were reaching roughly a third of the audience that link-free posts reached.
This isn't a marginal effect. Across 900,000+ posts and nearly every single month over three years, links in posts correlated with meaningfully lower reach.
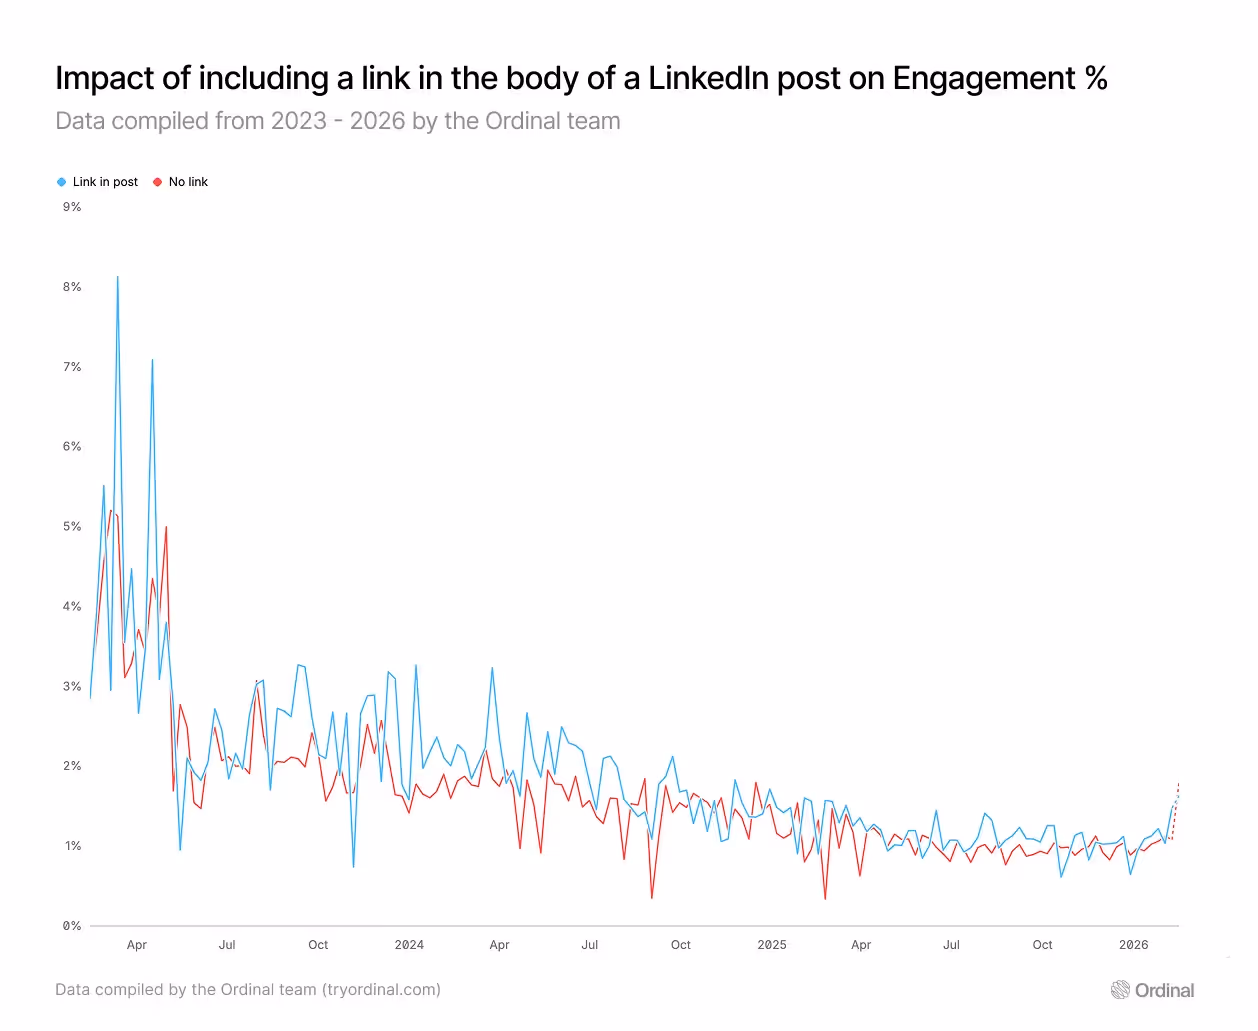
Links kill reach, but they boost engagement rate
Here's where it gets interesting. Links hurt reach, but they actually improve engagement among the people who do see the post.
- Link-in-post engagement rate: 1.246%
- No-link engagement rate: 1.023%
(We define engagement as likes + comments + shares divided by impressions.)
That's a 22% higher engagement rate for posts containing links.
This creates a real strategic tension. Say 1,000 people see your link-free post. You'd expect about 10 engagements. If your link post reaches only 735 people (the average penalty), you'd still expect about 9 engagements because each impression is more likely to convert.
The reach penalty and the engagement boost partially cancel each other out. But not completely. You still lose net engagement in absolute terms at the average penalty level.
What this means in practice: the right strategy depends on your goal. If you're optimizing for brand awareness and distribution, links cost you. If you're optimizing for clicks and conversions from an audience that already follows you, the tradeoff is more nuanced. The people who see your link post are more likely to interact with it.
Company pages get hit harder than personal profiles
The link penalty doesn't affect all accounts the same way. We broke the data down by account type, and the difference is significant.
Company pages:
- Reach ratio: 0.95 (a 5% reach penalty for link posts)
- Engagement ratio: 1.10 (a 10% engagement boost for link posts)
Personal profiles:
- Reach ratio: 1.01 (roughly neutral, no meaningful reach penalty)
- Engagement ratio: 0.95 (a 5% engagement drop for link posts)
Company pages bear the brunt of the penalty on reach. Personal profiles are largely immune. This flips the conventional wisdom that the penalty applies equally across all LinkedIn content.
For brand accounts, the takeaway is straightforward: be deliberate about when you include links, because you're paying a real reach cost. For individuals posting from personal profiles, the math changes. You can include links without meaningfully hurting distribution, though you may see a slight dip in engagement rate.
This distinction matters for organizations running both brand pages and employee advocacy programs. Your thought leaders sharing links from personal profiles won't face the same algorithmic headwind your company page will.
Does putting the link in comments actually work?
The most common workaround for the link penalty is dropping the URL in the first comment instead of the post body. We tracked this too, but the data comes with important caveats.
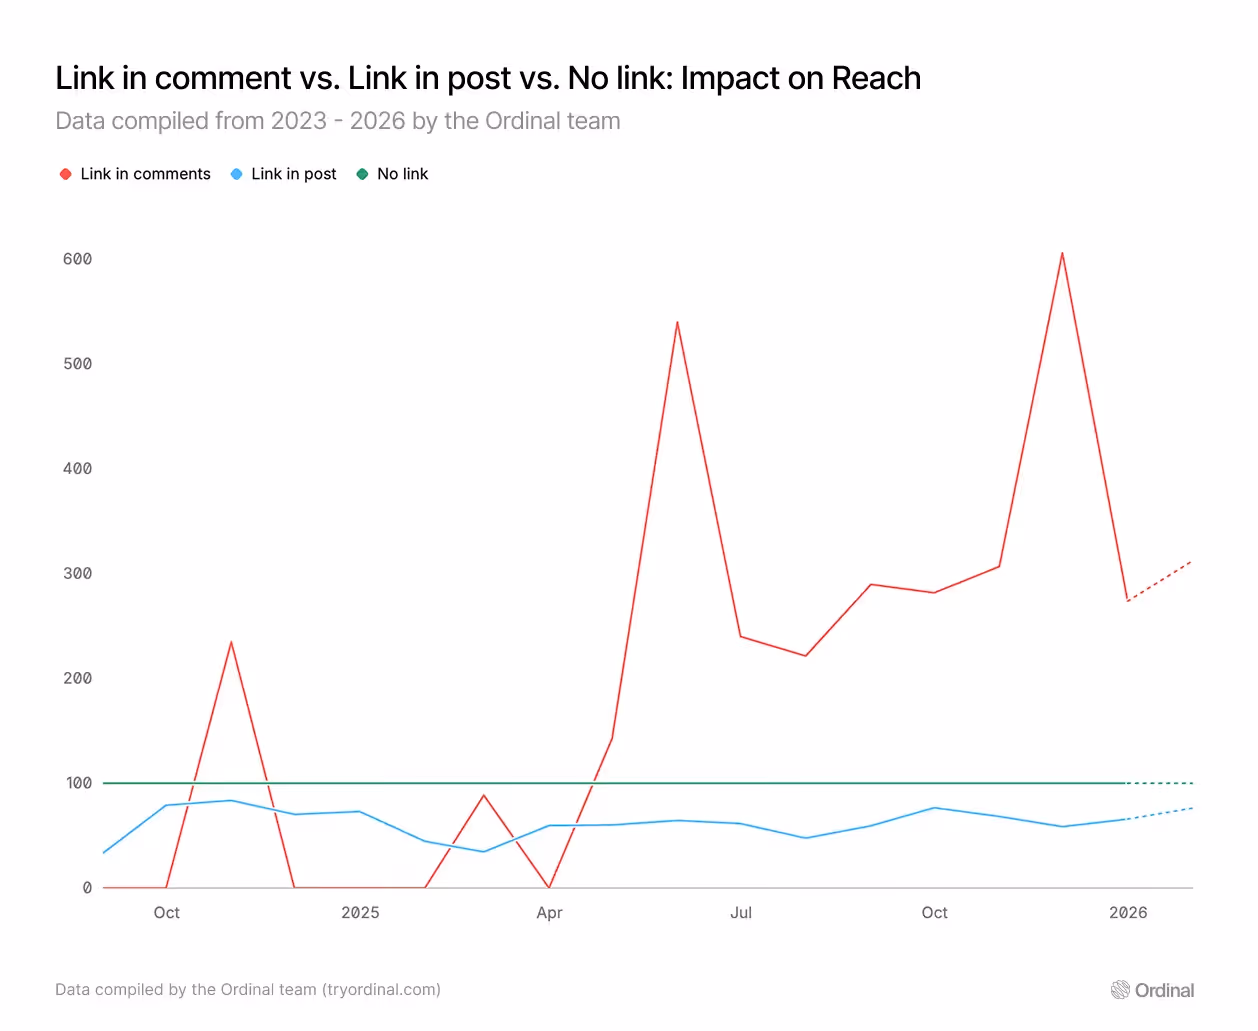
Link-in-comments tracking only became available in our dataset starting November 2024, and it covers a subset of months. When available, the reach scores for link-in-comments posts were consistently above the no-link baseline of 100, often by a wide margin.
Though we have less data available here, the effect is directionally positive. Across nearly every month we tracked, link-in-comments posts outperformed both link-in-post and no-link posts on reach. Treat this as a signal to test and monitor, not a guaranteed playbook.
LinkedIn says there's no penalty. Our data disagrees.
In 2025, LinkedIn's Sr. Director of Product publicly stated that there is no algorithmic penalty for including external links in posts.
We have no reason to doubt that LinkedIn believes this. Algorithmic systems are complex, and the people building them may not frame distribution differences as a "penalty."
The data tells a different story, though. In 34 out of 37 months across 900,000+ posts, content with external links reached fewer people than equivalent content without links. The gap widened from a 5% difference in 2023 to a 42% difference in 2025, and the difference is statistically significant in every year we measured (p < 0.001).
Whether you call it a penalty, a preference, or a side effect of engagement-weighted distribution, the outcome for publishers is the same: putting a link in your LinkedIn post will, on average, reduce how many people see it.
What should you actually do?
No single strategy works for every account or every objective. But the data supports a few clear guidelines.
If your primary goal is reach and awareness: Remove the link. Make the post self-contained. Deliver the insight, the story, or the value directly in the post body. If you need to reference a URL, mention it by name ("search for X on our blog") or drop it in the comments.
If your primary goal is clicks and conversions: The reach tradeoff may be worth it. Link posts get 22% higher engagement per impression. If you're targeting an audience that already follows you and you need them to click through, a link post still works. It just won't travel as far.
If you're running a company page: Be especially deliberate. Company pages face the reach penalty more than personal profiles. Save link posts for high-intent content where the click-through matters more than broad distribution. Use link-free posts for awareness and community building.
If you're posting from a personal profile: You have more room to experiment. Personal profiles show roughly neutral reach impact from links. Focus more on content quality than link placement.
On the link-in-comments approach: Directionally encouraging, but not definitive enough to call it a silver bullet. Worth testing with your own audience. Track your own reach and engagement numbers over 20-30 posts to see if the pattern holds for your specific account.
Above all: test with your own data. Aggregate trends across 900,000 posts are useful for directional guidance. But LinkedIn's algorithm weighs dozens of signals: your industry, your audience, your posting history, your content format. Run your own experiments. Measure what happens. Adjust.
A note on what this study can and can't tell you
This is an observational study, not a controlled experiment. We're measuring correlation between link presence and reach, not proving that links cause lower reach. There are confounders we can't fully account for: post topic, content quality, audience size, posting time, and the type of content that tends to include links vs. not. It's possible that link posts perform differently in part because they tend to be a different kind of post.
We also can't see inside LinkedIn's algorithm. The patterns we observe could reflect direct algorithmic downranking, indirect effects (link posts may get less early engagement, which then reduces distribution), or a mix of both.
That said, the reach difference between link and no-link posts is statistically significant in every year from 2022 onward (Mann-Whitney U test, p < 0.001), with 95% confidence intervals on the penalty ranging from 35%-48% in 2025. The correlation is strong, consistent across nearly every month, and has grown over time. We believe it's useful data for making better publishing decisions, but treat it as a strong signal to inform your strategy, not as proof of a single mechanism.
Methodology
This analysis covers 900,000+ LinkedIn posts published between February 2023 and February 2026 (37 months), tracked through Ordinal's analytics platform.
Reach indexing: We use two views of the data. The weekly chart indexes reach so that if both groups (link and no-link) had equal reach, they'd each score 100. When one line is higher, that group is getting proportionally more reach. For the monthly analysis and year-over-year comparisons, we set no-link reach to 100 each month and measure link-post reach relative to that baseline. A monthly score of 73.5 means link posts got 73.5% of the reach that no-link posts got that month.
Statistical testing: Reach distributions were compared using Mann-Whitney U tests (a non-parametric test appropriate for the heavy-tailed distribution of social media impressions). All year-over-year comparisons are statistically significant at p < 0.001. Confidence intervals on annual penalty estimates are reported at 95%.
Engagement rate: Calculated as (likes + comments + shares) / impressions. Clicks are excluded from the engagement numerator to isolate social engagement from link-click behavior.
Filtering: Posts with zero impressions were excluded.
Link-in-comments data: Available for a subset of months beginning November 2024. Subject to selection bias as noted above.
Account types: Company page and personal profile data were analyzed separately where noted. Aggregate figures include both account types.
This study was conducted by the Ordinal team using data from the Ordinal platform. Want to track your own LinkedIn performance with this level of detail? Ordinal is a social media scheduling and analytics tool built for teams that take distribution seriously.
Interested in more data-backed insights? Check out the next Ordinal Data Labs study about the ideal frequency to be posting on LinkedIn.
Related Posts
Looking to learn more? The below posts may be helpful for you to learn more about social media and content marketing.