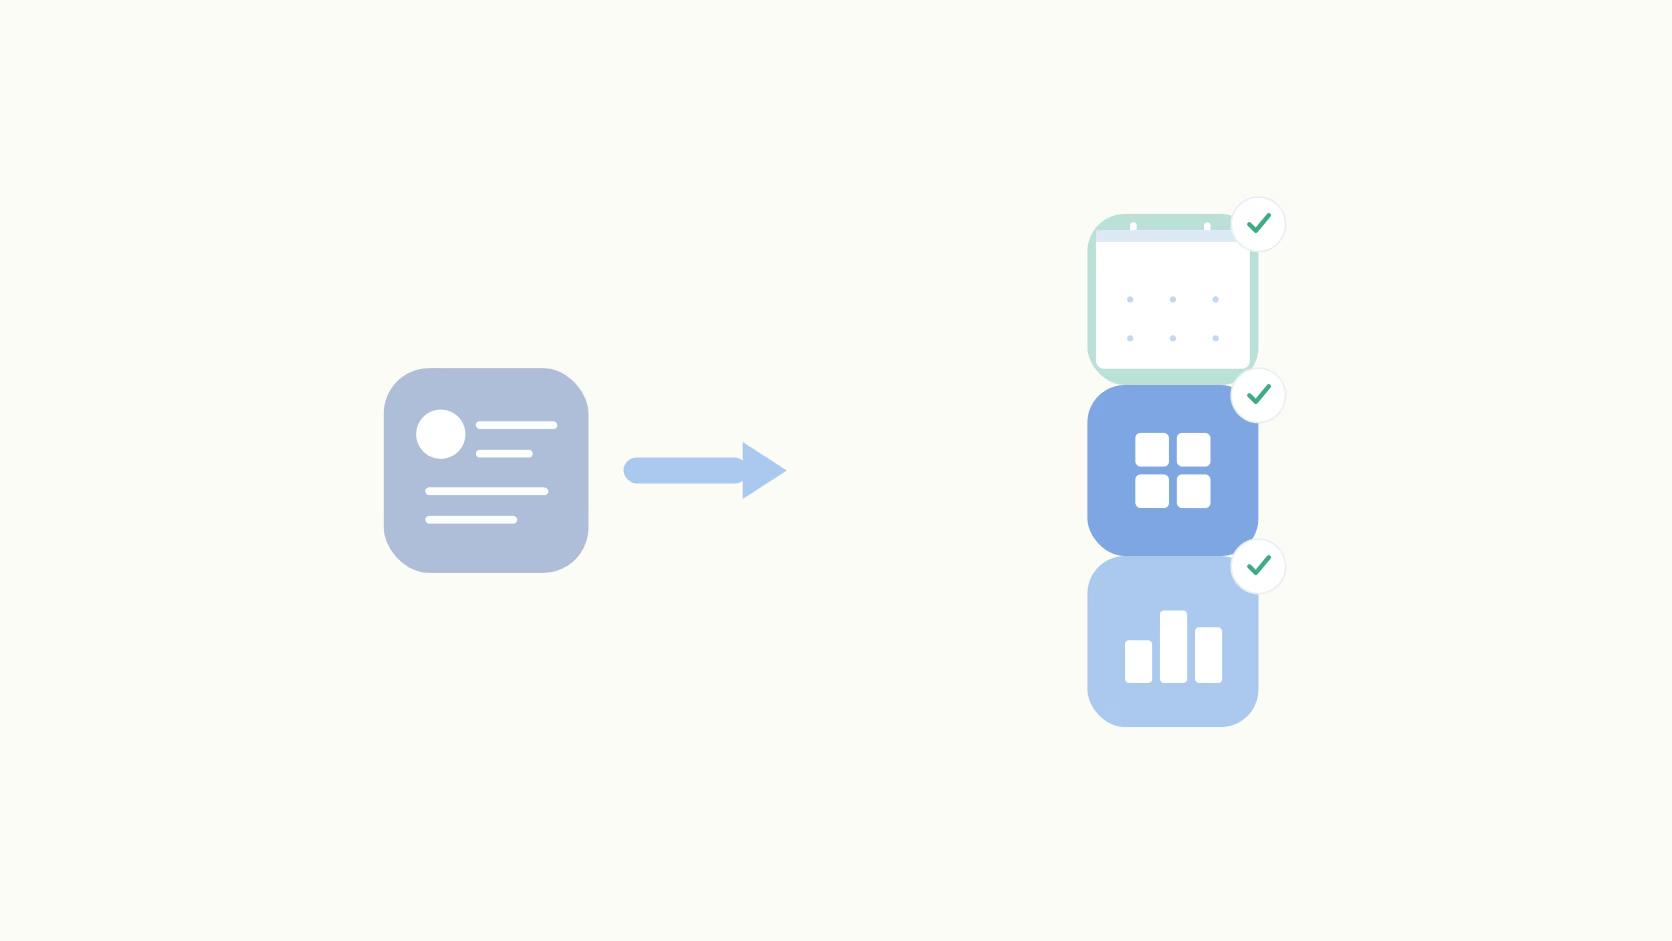

Every LinkedIn report starts in the same place: the Analytics tab, a date range, an XLS download. But how much of the audience does that file describe?
Twice a year, LinkedIn files a transparency report with the European Commission because EU law requires it. One number in the August 2025 filing has never appeared in your analytics tab: 213.1 million logged-out site visits from EU-based users in the first half of 2025, against an estimated monthly average of 54.7 million logged-in EU users (LinkedIn's transparency report, 2025).
LinkedIn measures its own audience far more granularly than it reports back to you. Every dashboard built on its public metrics inherits that ceiling. Yours can say how many impressions a post received. It can't say who saw it.
That gap is why the LinkedIn reporting tool category exists. It's also why most of the category is worth skipping. This one is for social managers reporting up, marketing leads defending a line item, and agencies proving retainer value.
TLDR:
- LinkedIn's free analytics cover impressions, engagement, follower growth, demographics, and post-level performance, and they export to XLS. For one page with one poster on a monthly cadence, that's enough.
- Native analytics break at three points: multi-account reporting, content-category comparison, and any metric that needs a dollar figure attached.
- Impression counts are structurally incomplete, and LinkedIn's own regulatory filing is the proof.
- Pay for a LinkedIn analytics tool when you report across three or more accounts, need labels applied at publish time, or have to name the people who engaged.
- Ordinal does label-based analytics, Earned Media Value, and campaign reporting inside the same platform that drafts and schedules the posts.
What Is a LinkedIn Reporting Tool?
A LinkedIn reporting tool is software that pulls performance data from LinkedIn's API (impressions, engagement, follower growth, click-throughs) and turns it into dashboards, exports, and scheduled reports across one or more accounts. It exists because LinkedIn's native analytics are per-account, per-page, and time-capped.
Three things get conflated in this search.
- Native analytics are free and built into LinkedIn
- A reporting tool reads data out and stops there
- A social management platform reads and writes, so drafting, scheduling, approvals, and reporting live together
Most people searching this term end up on the third option. The reason is simple: a reporting-only subscription means paying twice, once for the thing that publishes and once for the thing that measures.
Scope matters before you evaluate anything. Organic page reporting, personal profile reporting, and LinkedIn Ads reporting are three separate data sources with three separate sets of API permissions.
What LinkedIn's Native Analytics Give You
Free, today, inside the Analytics tab: page-level impressions, engagement rate, follower demographics by job function and seniority, visitor metrics, competitor benchmarking, post-level performance, and an XLS export.
That covers more ground than it did two years ago.
Then there are the ceilings. Historical data doesn't go back indefinitely, so year-over-year reporting only works if you were already exporting on a schedule. You get one account at a time, with no unified view of a company page plus five executive profiles.
And there's no custom segmentation. You can't tag a post as "product launch" versus "thought leadership" and compare the two. That last one is the most common reason teams upgrade.
The logged-out figure in LinkedIn's Digital Services Act filing is a regulatory disclosure, not a vendor claim. It describes real consumption that logged-in session analytics don't fully capture. Impressions describe what LinkedIn chose to count and show you, on a denominator the algorithm controls.
If you run one page and report once a month, export from LinkedIn and keep your money.
The LinkedIn Metrics That Belong in Every Report
Two tools will report different engagement rates for the same post. The reason is almost always the denominator.
Here's the arithmetic, so you can audit any LinkedIn analytics dashboard someone puts in front of you.
- Impressions. The number of times a post rendered in a feed. Not unique people.
- Reach, or unique impressions. The number of distinct members who saw it.
- Engagement rate. The LinkedIn engagement rate formula we use is (likes + comments + shares) ÷ impressions, excluding clicks.
- Follower growth rate. Net new followers ÷ starting followers, over a fixed period.
- Earned Media Value. What your organic impressions would have cost as paid reach at your channel CPM.
Imagine this: a post gets 12,400 impressions, 289 likes, 41 comments, and 18 shares. That's 348 ÷ 12,400 = 2.81%. Fold in 210 link clicks and the same post reports 4.50%. Same post, 60% higher number, purely from the denominator choice.
EMV works the same way. Your page generated 640,000 organic impressions last quarter, and at a $32 CPM that's 640 × $32 = $20,480 in earned media value. That number survives a budget conversation. "Impressions were up" doesn't.
Follower growth is the simplest of the three: 8,400 followers at the start of the quarter, 9,180 at the end, so 780 ÷ 8,400 = 9.3%.
One methodological note matters more than any of the formulas. Summarize post performance with the median, not the mean. One viral post drags the average high enough that the report starts lying to you.
Native Analytics vs. a Third-Party Reporting Tool: How to Decide
Paying for a tool is justified by one of three conditions. If none of them apply, the free export wins on cost and on honesty.
The first is multi-account. You report on a company page plus executive and employee profiles as a single program, and stitching six XLS files together every month is a job nobody assigned you.
The second is content-category attribution.
You need to know whether case studies outperform hiring posts, which requires labeling posts when they publish. No after-the-fact reporting tool can retrofit that, because the metadata never existed.
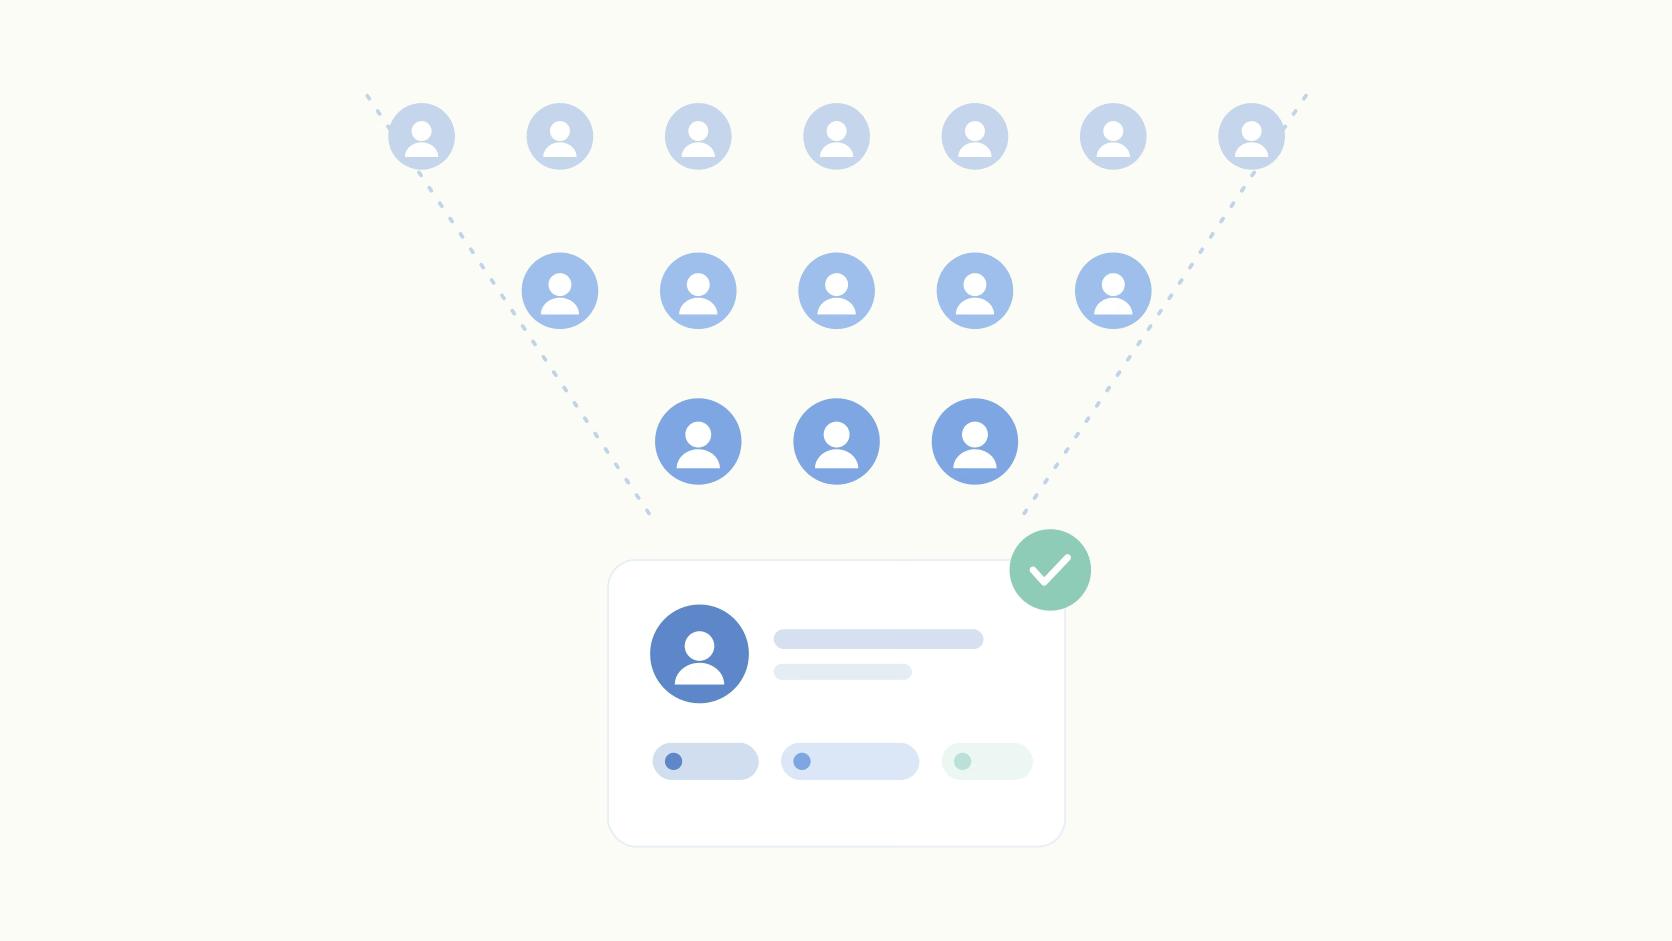
The third is identity, and it's the one that changes renewal conversations. Aggregate demographics tell you a large share of your audience sits in operations. A list of named engagers matched to target accounts tells your CEO that fourteen people at nine accounts touched your content this quarter. That's the version of the report that gets remembered.
So when you evaluate a vendor, the first question isn't whether it exports to PDF. Ask whether it can hand you individuals, matched to companies, per post.
"We'll just build a Google Sheet," you say. Sure. It works for about two months, until the week someone's on holiday and three posts go out unlabeled. Nobody backfills a spreadsheet retroactively.
Meanwhile the surface area keeps growing. LinkedIn reached 1.20 billion members in January 2025, with its ad-addressable audience up 176 million members, or 17.1%, year over year (LinkedIn's addressable audience, DataReportal, 2025).
How to Build a LinkedIn Report in Six Steps
- Fix the reporting period and lock it: Monthly or quarterly, the same window every time, because mixed windows are why month-over-month comparisons quietly stop meaning anything.
- Choose your engagement rate denominator before you pull data: Write it down somewhere the whole team can see, and use it in every future report.
- Label posts at publish time: Product launch, thought leadership, case study, hiring, culture. Three to six labels maximum, because past that no category has a big enough sample to compare against another.
- Pull account-level and post-level data separately: Account-level answers whether the program is growing, post-level answers what's working, and reports that blend the two answer neither.
- Report medians alongside totals, and name your top three posts by engagement rate explicitly. Leadership remembers a specific post and forgets an average within a day.
- Convert impressions to EMV and put that number at the top: If you have engager-level data, list the accounts underneath it.
Delivery format is best on one page, one chart, one table, three named posts. Longer than that and it doesn't get read past the first screen.
LinkedIn Reporting by Team Type
The right setup depends on how many accounts you report across and who reads the report, not on how much budget you have.
A solo founder or executive needs native profile analytics and a monthly manual export. A tool is only worth it if someone is ghostwriting for you, and then you're really buying the approval workflow. Reporting arrives as a side effect.
An in-house B2B marketing team hits the break point at a company page plus three or more employee accounts. From there, label-based analytics and EMV are the two features that matter, because you're defending a line item to someone who thinks in dollars.
Agencies have a different problem: the same report, thirty times, with client-facing polish. What matters is per-client workspaces, share links for stakeholders who will never log into the tool, and campaign-level rollups. Per-seat pricing is what makes legacy platforms untenable at that volume, which is worth reading up on if you're comparing agency social tools side by side.
One note on LinkedIn Ads reporting. CPC, CTR, and cost per lead live in Campaign Manager and come from a separate API. Ask any vendor promising unified organic and paid reporting exactly which ad-account permissions they need.
How Ordinal Handles LinkedIn Reporting
Ordinal reports on LinkedIn from inside the platform that publishes the posts. The label, campaign, approver, and version are already attached before the post goes live, so nothing has to be reconstructed later.
- Label-based analytics, so performance breaks out by content category
- Earned Media Value with a custom CPM per channel
- Campaign-level reporting and content-type filtering across image, video, PDF, and text-only
- Daily automatic analytics refresh across LinkedIn, X, Instagram, and Facebook, plus on-demand refresh
- Top-performing posts surfaced automatically for any account and date range
- AI Reporting in beta, which surfaces patterns like one content bucket outperforming another
For teams that need identity rather than aggregates, Leads Data on the Enterprise plan shows which individual LinkedIn users liked or commented on a post. That's how you route warm engagers to sales instead of reporting a number nobody can act on.
Final Thoughts
If you report on one company page once a month, export the XLS and spend the budget elsewhere.
If you're reporting across multiple accounts, need to know which content category is carrying the program, or have to put a dollar figure on organic reach, the free export stops being free the moment you count the hours it costs.
Two things to do this week. Both free, both impossible to retrofit later. Pick your engagement rate denominator and write it down where the team can see it. Then start labeling every post at publish time, with no more than six categories.
Frequently Asked Questions
Does LinkedIn Have a Built-In Reporting Tool?
Yes. LinkedIn's native Analytics tab covers page-level impressions, engagement, follower demographics, visitor data, competitor benchmarking, and post-level performance, and it exports to XLS. It's free and genuinely enough if you're reporting on one account once a month, but it breaks down once you need multi-account reporting or content-category comparison.
How Do I Export LinkedIn Analytics?
On a company page, open the Analytics dropdown, pick the metric view, set the date range, and hit Export for an XLS file. Personal profiles only offer a narrower export from the post analytics view. The historical window is capped, so if you want year-over-year comparison, start exporting on a schedule now rather than pulling it retroactively.
What Is a Good LinkedIn Engagement Rate?
Published LinkedIn engagement benchmarks rarely disclose sample size, date range, or how engagement is defined, which makes them close to useless for comparison. Your own median from the previous quarter, using one fixed denominator, is a far better benchmark. Compare each post to your own baseline instead of a number from a blog aggregator.
How Is LinkedIn Engagement Rate Calculated?
The common formula is (likes + comments + shares) divided by impressions. Some tools fold clicks into the numerator, which inflates the rate for the same post. Pick a definition, write it down, and stay consistent, because a report that changes its denominator every quarter isn't measuring anything real.
Can I Report on LinkedIn Organic and LinkedIn Ads in One Tool?
Some platforms handle both, but they pull from separate LinkedIn APIs with separate permissions. Organic page data and Campaign Manager data come from different sources, so unified LinkedIn Ads reporting means the vendor needs ad-account access on top of page access. Ask directly which permissions a tool requires before assuming one dashboard covers everything.
How Much Does a LinkedIn Reporting Tool Cost?
Pricing splits between per-seat models, which get painful past five or six people, and per-workspace or flat-rate models built for agencies running many client accounts. Reporting-only tools sit cheaper but force you to run a separate scheduler, while bundled platforms cost more monthly and replace two subscriptions with one.
Do I Need a LinkedIn Reporting Tool for Just One Company Page?
Probably not. One page, one poster, monthly reporting is exactly what LinkedIn's free export handles well. The case for a paid tool starts once you add executive accounts, need content-category attribution, or have to deliver reports to stakeholders who won't log into LinkedIn themselves.
Why Don't My Reporting Tool's Impressions Match LinkedIn's Native Numbers?
Usually it's a different attribution window, different refresh timing, or a different definition of an impression versus a unique view. LinkedIn's own transparency reporting also shows meaningful logged-out consumption, so neither number is a complete picture. Consistency across periods matters more than getting two dashboards to match.
Related Posts
Looking to learn more? The below posts may be helpful for you to learn more about social media and content marketing.