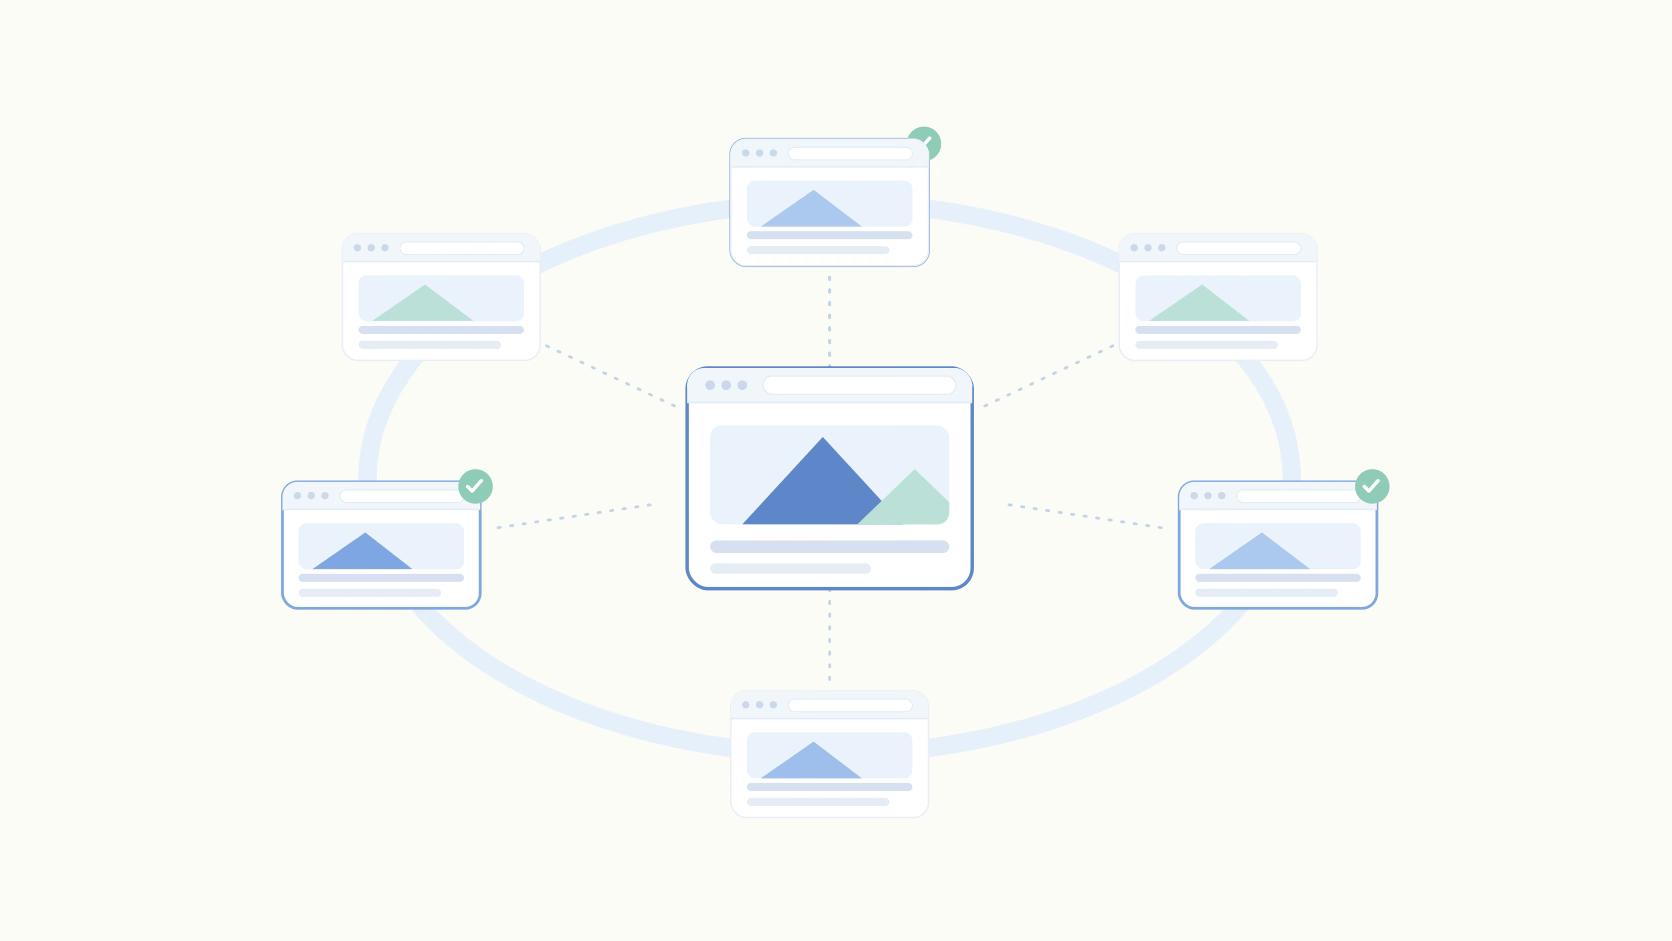
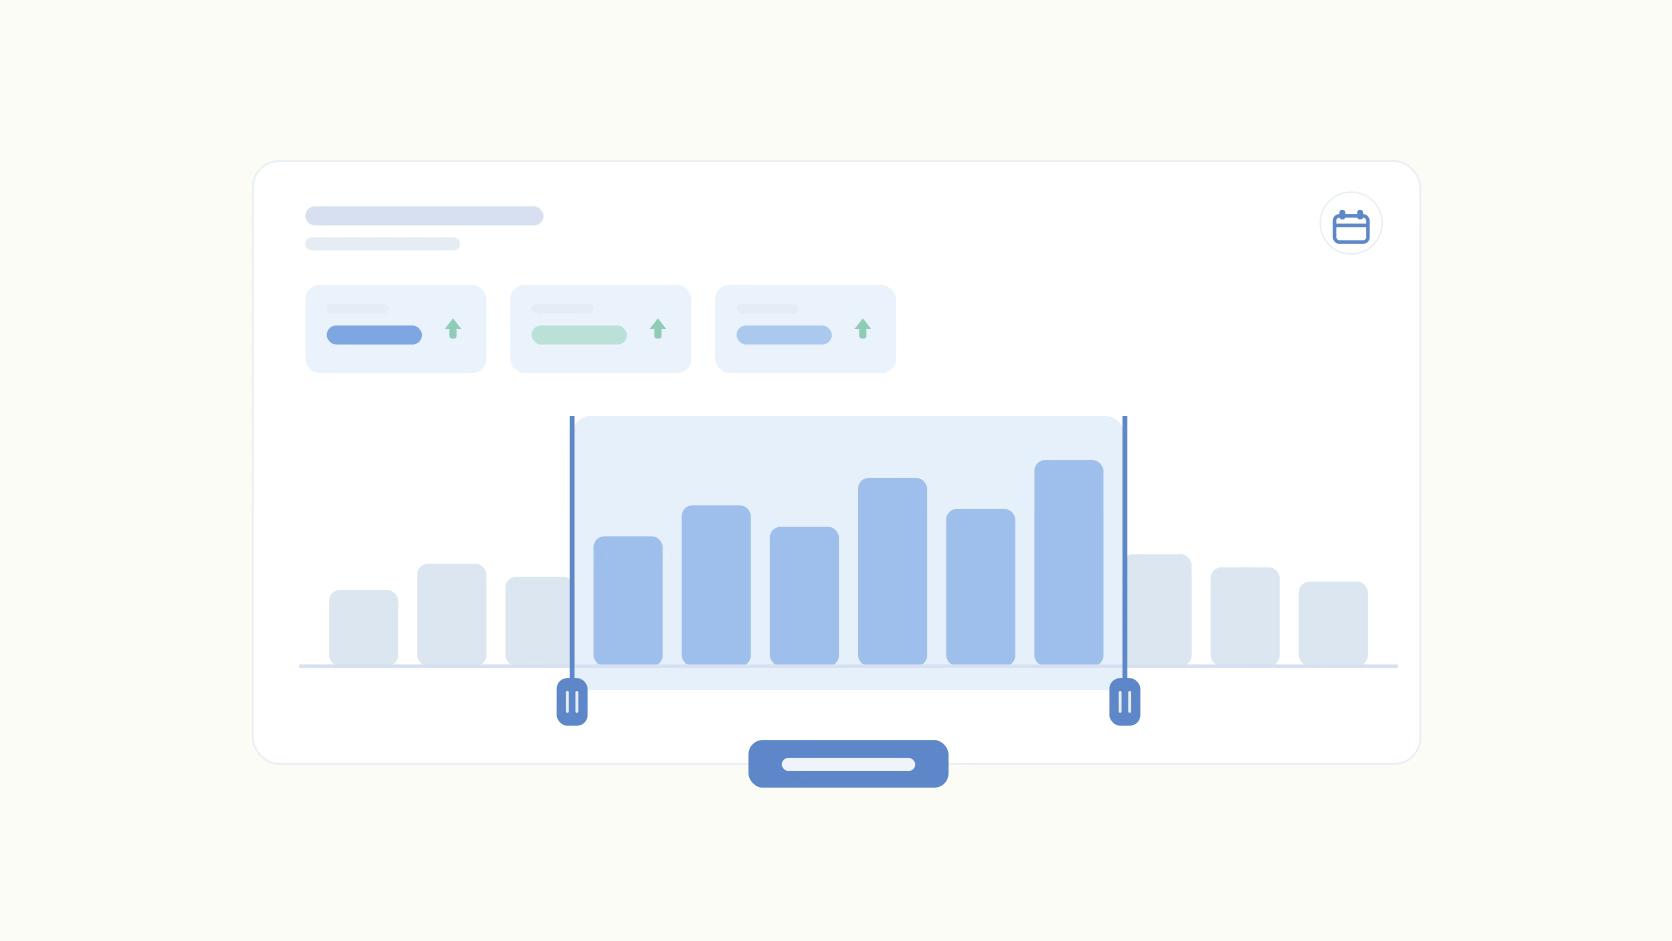
Two versions of the same LinkedIn report land on the CMO's desk. One shows engagement up significantly, and the other shows it flat. Same account, same posts, same platform. The only difference is that one covers the calendar month and the other covers the trailing 30 days ending Friday.
A reporting period is the window of time a report covers. Teams argue about metrics constantly and almost never about the window those metrics are measured over, even though the window decides the answer.
TLDR:
- A reporting period is the defined time window a report covers, setting the boundary for what counts and what it gets compared against.
- In finance the period is structured and often regulated. In marketing analytics it's a discretionary choice you should be able to defend.
- Fixed periods (calendar month, quarter) are for stakeholders. Rolling periods (trailing 30 or 90 days) are for operators.
- The better rule is volume, not days: if the window holds fewer than about 30 posts, one good post entering or leaving it can swing your headline number by double digits.
- Ordinal supports custom date ranges across LinkedIn, X, Instagram, and Facebook, with daily analytics refresh and filtering by content type, label, and campaign inside the same window.
What Is a Reporting Period?
A reporting period is the defined window of time that a report covers, setting the start and end boundaries for which data is included, aggregated, and compared. It applies to financial statements, marketing dashboards, compliance filings, research studies, and any recurring report.
Every reporting period has three components:
- A start date
- An end date
- A comparison baseline
Teams define the first two and forget the third. That's where the trouble starts.
Let's be clear: the reporting period is not the reporting date.
The period is the window the data covers while the date is when the report gets built. A monthly LinkedIn report covering March is usually assembled on April 3rd, while March's impressions are still settling.
In accounting, none of this is up to you. Books close monthly, quarters roll up into a fiscal year, and public companies file on fixed interim schedules. In marketing analytics, no regulator imposes a window.
That's exactly why the choice carries so much weight and gets so little thought.
Fixed vs. Rolling Reporting Periods
Fixed periods are for stakeholder reporting. Rolling periods are for operating decisions. Teams get burned when they use one where the other belongs.
Fixed periods line up with the business calendar, compare cleanly across the org, and can be quoted in a board deck without a caveat. Their weakness is that the boundaries are arbitrary. February has 28 days and roughly three fewer posting days than January, so a month containing two public holidays and a conference week isn't comparable to a clean one.
But the monthly report treats them as equals anyway.
Rolling periods are always the same length. That kills most calendar artifacts and makes them far better for answering "is this change working." The cost is that the number moves every day, so nobody can cite it in a meeting a week later without recalculating.
"Just report both," you say. Fine, but only if the baselines stay consistent.
Comparing a calendar month against a trailing 30-day prior period is the most common error in social reporting, and the delta it produces means nothing at all.
The deeper issue sits underneath both options. A calendar month is a container for days. What a social report needs is a container for posts. If a team publishing a modest number of posts a month reports a sharp drop in engagement month over month, the swing can be nothing more than one carousel leaving the window.
That gets read as a verdict on the team's work, and budget decisions follow.
How to Choose Your Reporting Period Cadence
- Start from the decision, not the calendar: Ask what the report is supposed to settle. A board update is quarterly because the board meets quarterly. A "do we keep making carousels" decision needs 8 to 12 weeks of data no matter when the month ends.
- Count posts, not days: Aim for at least 30 published posts before you'll accept a performance verdict from the window. A team shipping 4 posts a month has no basis for a monthly judgement. That team's real reporting period is a quarter.
- Match the period to the metric's lag: Follower growth is slow and reads well monthly. Engagement rate reads at weekly. Pipeline influenced by social lags by however long the sales cycle runs. If deals take five months to close, a 30-day window will never show social's contribution.
- Lock the comparison baseline before you look at the data: Decide up front: prior period, same period last year, or a rolling average. Picking the baseline after you've seen the numbers turns reporting into advocacy.
- Write the definition down and reuse it: One line at the top of every report: "Period = calendar month. Comparison = prior calendar month. Timezone = UTC. Data pulled 3 days after period close." Boring habit. It removes most reporting arguments before they happen.
Reporting Period vs. Accounting Period vs. Fiscal Year
A reporting period is the window a specific report covers. An accounting period is the standardized window a business closes its books over, usually a month, quarter, or year. A fiscal year is the 12-month accounting period a business uses, which may or may not match the calendar year.
A fiscal year is built from accounting periods. A reporting period can align with one, span several, or ignore them completely. A campaign report running March 14 to April 9 matches no accounting period at all, and that's fine.
The practical trap is benchmarking.
A retailer with a fiscal year ending January 31 reports Q4 as November through January, so its "Q4 social performance" covers different months than a calendar-year company's Q4. Compare the two and you're comparing different weather.
One more case worth flagging: the stub period. An account that launched on the 19th produces a short window, and annualizing a stub period exaggerates everything in it.
The Comparison Period Problem
A reporting period without a defensible comparison period is a number without meaning. A raw impression count for the month, quoted on its own, tells a stakeholder nothing. So every report supplies a baseline, and the baseline is usually whatever the dashboard defaulted to.
Three baselines are worth using:
- Prior period suits short cycles and fast iteration but has no defence against seasonality, so a report covering late December will always look like a collapse
- Same period last year handles seasonality properly and becomes useless the moment strategy changed six months ago
- A rolling average, ideally trailing 90 days, smooths outliers and is the only honest denominator when output is lumpy, which is most B2B teams.
It's harder to explain in a meeting, so explain it once and keep using it.
Then there's the arithmetic. Comparing a 31-day month to a 28-day month and reporting the raw delta puts February at a built-in disadvantage on any volume metric before anyone writes a word. Posting volume does the same thing in reverse. Publish 14 posts against last period's 9 and total impressions rise because you posted more, which says nothing about whether the content improved.
Here's worked example, with illustrative numbers:
Say March had 14 posts and 168,000 total impressions, and February had 9 posts and 117,000. Total impressions are up 43.6%. But per post, March averaged 168,000 ÷ 14 = 12,000 against February's 117,000 ÷ 9 = 13,000, so performance fell 7.7%. And on a daily basis March ran 5,419 impressions per day against February's 4,179, up 29.7% rather than 43.6%. Same data, three stories. Only the per-post figure speaks to content quality.
But report the median per post, not the average.
A single post that hits 90,000 impressions drags the mean until it stops describing anything, and in a 14-post window that post is 54% of the total.
Setting Reporting Periods in Your Analytics Stack
There are three things a tool needs before reporting periods become workable:
- Arbitrary custom date ranges rather than preset "last 30 days" buttons
- Data fresh enough that the window isn't half-settled
- The ability to slice one window by content type, label, and campaign without exporting anything.
The freshness part gets underrated. LinkedIn impressions keep accruing for days after publish. So if your analytics refresh weekly, a report built Monday morning for a period ending Sunday is measuring numbers that hadn't finished happening.
Ordinal refreshes post and account analytics daily across LinkedIn, X, Instagram, and Facebook, with manual refresh on demand, so a period-end report reflects settled data.
Custom date ranges work at both account and post level, and the same window can be filtered by content type, label, or campaign, which means "did carousels beat text posts in Q1" is one filter instead of a spreadsheet. Earned Media Value puts a dollar figure on the period, and top-performing posts surface automatically for any account and range.
Final Thoughts
Pick the fixed period stakeholders will quote, keep a trailing 30-day view open for the team, and set the comparison baseline before anyone opens the dashboard.
The volume rule is worth adopting this quarter. If the window holds fewer than about 30 posts, report it as a trend line rather than a verdict, and say so out loud in the meeting. Put per-post medians next to totals every time, so the reader can tell the difference between posting more and posting better.
And once the period is defined, leave it alone. Changing the window because this month's number came in red is the cheapest thing a marketing team can do and the most expensive thing to be caught doing.
Frequently Asked Questions
What Is a Reporting Period in Simple Terms?
A reporting period is the span of time a report covers, marked by a start date and an end date. Everything inside that window counts toward the report and everything outside it doesn't, no matter how relevant it feels. The same concept applies to financial statements and marketing dashboards alike.
What Is the Difference Between a Reporting Period and an Accounting Period?
An accounting period is the standardized window a business closes its books over, usually a month, quarter, or year. A reporting period is the window any specific report covers, and it can match an accounting period or ignore it entirely. A campaign report running March 14 to April 9 is a valid reporting period that lines up with no accounting period at all.
Can a Reporting Period Be Shorter Than a Month?
Yes. Weekly and even daily reporting periods are common for fast-moving campaigns, and short "stub" periods happen naturally when an account launches partway through a standard cycle. The tradeoff is noise: a single outlier post distorts a short window far more than a longer one.
How Do I Choose the Right Reporting Period for Social Media Analytics?
Start with the decision the report is meant to drive, not the calendar. Use monthly fixed periods for stakeholder updates and trailing 30 or 90 day windows for operating decisions, and make sure the window contains enough posts to reveal a pattern rather than one viral outlier dressed up as a trend.
What Is a Reporting Period vs. a Fiscal Year?
A fiscal year is a specific 12 month reporting period a business uses for accounting, and it doesn't have to match the calendar year. A retailer with a fiscal year ending January 31 reports "Q4" as November through January, while a calendar-year company's Q4 is October through December. Benchmark against the wrong one and you're comparing different months without realizing it.
Should I Compare This Period to the Previous One or to the Same Period Last Year?
Use the prior period for short cycles and fast iteration, and use the same period last year when seasonality genuinely affects your numbers. Year-over-year comparison stops meaning much if your strategy changed substantially in between. Decide the baseline before you look at the numbers, not after.
Why Do My Analytics Numbers Change After the Reporting Period Ends?
Platform metrics keep accruing after a post publishes, and LinkedIn impressions in particular continue climbing for days. A report built the morning after a period closes is measuring data that hasn't finished settling, so build period-end reports a few days after the close and use a tool that refreshes daily.
How Long Should a Reporting Period Be to Get Reliable Social Data?
Long enough that no single post dominates the result. A team posting two or three times a week can trust a 30 day window, while a team posting weekly needs to stretch to 90 days before drawing any real conclusion about content performance.
Related Posts
Looking to learn more? The below posts may be helpful for you to learn more about social media and content marketing.