Marketers say 25% of marketing budget is wasted on efforts that fail to drive outcomes (DemandScience, 2026). Identifying which portion, in a given quarter, is the job a campaign performance report is supposed to do, and the job most of them don't finish. You're building one because someone above you is going to ask whether the spend was worth it, and the twelve charts in your current deck wouldn't settle that argument either way.
Every metric gets equal billing, so nothing carries a decision. Our position: your report should be shorter than the one you're sending now.
TLDR:
- A campaign performance report has one job: tell a decision-maker whether to keep funding the campaign
- Lead with the metrics marketers rank highest (lead quality/MQLs at 39%, lead-to-customer conversion at 34%, ROI at 31%) and push impressions and engagement rate to an appendix
- Benchmark against real B2B numbers rather than last month's version of yourself: 6.66% average CTR, $70.11 cost per lead
- Segment by campaign type, because blended averages hide the unit-economics differences you're being asked to act on
- Match cadence to audience: weekly for the operator, monthly for the marketing lead, quarterly for the exec
What Is a Campaign Performance Report?
A campaign performance report is a periodic summary of a marketing campaign's results measured against its stated goal, covering spend, output metrics, and outcome metrics for a defined time window. Its purpose is to support one decision: continue funding the campaign, adjust it, or stop.
A dashboard runs continuously, serves itself, and interprets nothing. An analytics export is raw data with no argument attached.
Remember, a report does have a point of view.
Five components belong in every one, regardless of channel: the goal as it was originally set, the spend, the output metrics, the outcome metrics, and the recommendation. The last one is where reports usually die. They stop at output metrics, hand over the interpretation, and leave the person best positioned to draw the conclusion (you) doing none of the concluding.
Why Campaign Performance Reports Fail
The average campaign performance report is too long and reports too much. Three things cause it.
The first is platform-default reporting.
Every ad platform exposes forty-plus metrics, and the path of least resistance is to include all of them, because volume reads as rigor. It isn't. Twelve charts that each describe activity are twelve ways of avoiding the sentence "we should cut this."
The second is the missing benchmark.
A CTR means nothing on its own, so the reader falls back on comparing it to last month, which measures your drift rather than your performance.
And the third is the missing recommendation.
The report ends with data, the interpretation gets outsourced to whoever opens the file, and by the time it reaches the VP the numbers have been read three different ways.
The obvious objection is fair: leadership does ask for the detail. But they ask because the summary didn't answer their question. When the first page says "reduce spend on Campaign B substantially, here's the cost per lead gap that justifies it," the follow-up requests get specific instead of exploratory.
Detail goes in an appendix, which most people never open, and that's fine.
Which Metrics Belong in a Campaign Performance Report
The metrics that belong are the ones tied to the campaign's stated goal, plus spend. Everything else is context, and context goes below the fold.
Marketers already know this, which makes the average report stranger. Lead quality and MQLs rank as the top metric at 39%, followed by lead-to-customer conversion rate at 34% and ROI at 31% (HubSpot, 2026). All three are outcome metrics. Yet the summary page of most reports opens with impressions.
The distinction worth holding onto: impressions, reach, CTR, and engagement rate are output metrics, while MQLs, pipeline, closed revenue, and cost per acquisition are outcome metrics. Output diagnoses, outcome decides.
If your primary number came in low, the output metrics tell you where the funnel broke, which is useful in paragraph four and useless in paragraph one.
Metrics to Move to the Appendix
- Impressions and reach as standalone numbers, unless the goal was awareness and you have a lift measurement to pair them with
- Follower growth, when the campaign wasn't a follower campaign
- Blended averages across channels, which smooth away the very differences you're being asked to act on
- Any metric you can't connect to the campaign's stated goal in one sentence
Organic and social campaigns are the awkward case here, since they rarely produce a clean CPA. Earned media value is the workaround: calculate what the same impressions would have cost as paid placements at a defined CPM, and organic gets a dollar-denominated line instead of sitting in an engagement section nobody weighs against spend.
Benchmark Your Numbers Against Something Real
Month-over-month change measures your own drift. A campaign can improve markedly from one month to the next and still return well below what the channel typically does, and a report built only on internal comparison will never surface that.
So bring an external number. B2B PPC averages a 6.66% click-through rate, $5.26 cost per click, 7.52% conversion rate, and $70.11 cost per lead (KLIQ Interactive, 2025).
When your numbers land below benchmark, the report names the gap on page one. The reader will find it eventually, and them finding it first is worse for you than flagging it yourself.
One caveat: these are directional. Industry, average contract value, and audience size all move them. A given cost per lead can be disastrous at a low average contract value and perfectly cheap at a high one. Use benchmarks as a sanity check rather than a target.
Segment by Campaign Type or the Averages Will Lie
Aggregate reporting hides the distribution, and the distribution is where the decision lives.
If two things in the same bucket have materially different unit economics, they need separate lines in the report. An automated email flow and a one-off broadcast share a channel and almost nothing else, and collapsing them into a single "email performance" line produces a budget call that's wrong in both directions. Segment paid by campaign objective, organic by content format, email by automated versus broadcast.
Cross-channel reporting fails the same way in a different shape. A click in Google Ads and a click in an email platform aren't the same event, and stacking them into one number produces a figure nobody should act on. Report channels in parallel columns and normalize only at the outcome layer, where leads, pipeline, and revenue genuinely mean the same thing.
How to Build the Report
- Write the campaign goal at the top, in the form it was set. If nobody wrote a goal before launch, the report's first job is to say so plainly.
- Pull the spend figure next. Every other number is being weighed against it, so it anchors the page.
- Pick one primary outcome metric. Not three. The one that determines whether the campaign continues.
- Add two or three supporting output metrics that explain the primary number, so a low result comes with a diagnosis attached.
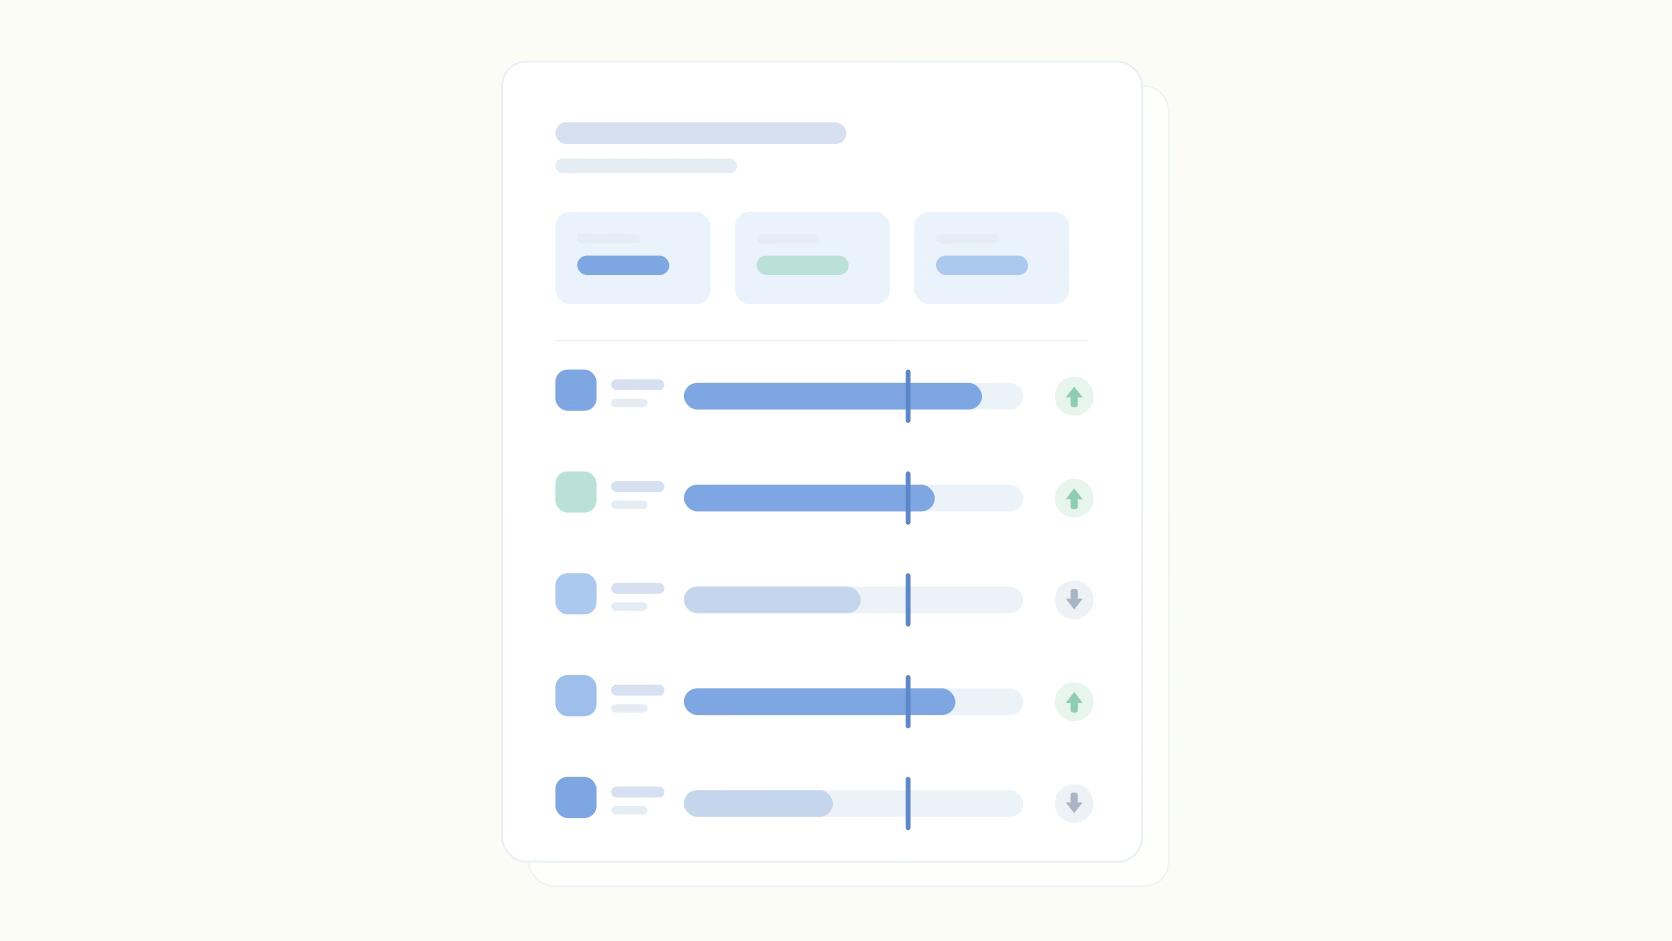
- Add a benchmark column. External benchmark where one exists, prior-period figure where it doesn't.
- Write the recommendation in one sentence before you write anything else. Continue at current spend, increase, reduce, or stop. If you can't write that sentence, the report isn't finished, and pulling more data won't finish it.
If the summary runs past one screen, everything below the fold is appendix.
Reporting Cadence: How Often to Send What
Cadence should match the decision speed of the audience, so operators get weekly, marketing leads get monthly, and executives get quarterly. Sending the same report at all three intervals is the reason nobody opens any of them.
One exception is worth naming, though.
An active paid campaign in its first two weeks warrants daily checks, but those are checks rather than reports, so don't formalize them into a document with a distribution list. And the only cadence that survives a busy quarter is an automated one, which is why teams tend to pull analytics through an API or a tool like Ordinal rather than rebuilding the export by hand every month.
What to Do Before Your Next Planning Meeting
Open the report you sent last month, and delete every metric you can't connect to the campaign's stated goal in a single sentence. Delete the blended cross-channel averages too, since they were never actionable. What's left is your report, and it will be shorter and harder to argue with than the version it replaced. If the exercise leaves you with a page that can't identify which share of spend is dead weight, that's the finding, and it belongs at the top of the next one.
Frequently Asked Questions
What Should Be Included in a Campaign Performance Report?
A campaign performance report needs five things: the campaign goal as it was originally stated, total spend, one primary outcome metric, two or three supporting output metrics, and a written recommendation. Anything else, including impressions and follower counts, belongs in an appendix rather than the summary.
What's the Difference Between a Campaign Performance Report and a Dashboard?
A dashboard is continuous and self-serve, updating in real time and leaving interpretation to whoever's looking at it. A campaign performance report covers a fixed time window, measures results against a stated goal, and ends with a recommendation. Dashboards answer "what's happening right now," reports answer "what should we do about it."
How Often Should You Send a Campaign Performance Report?
Match the cadence to the audience, not to a calendar habit. The person running the campaign day to day needs a weekly check, the marketing lead needs monthly, and executives need quarterly.
What Is a Good Conversion Rate for a B2B Campaign?
B2B PPC campaigns average a 7.52% conversion rate alongside a $70.11 cost per lead. That's a sanity check, not a target, because industry, average contract value, and offer type all move these numbers meaningfully.
Which Metrics Matter Most in a Marketing Campaign Report?
Marketers rank lead quality and MQLs highest at 39%, followed by lead-to-customer conversion rate at 34% and ROI at 31%. These are outcome metrics, and they belong in the summary of any campaign performance report, while output metrics like impressions and click-through rate explain why a number moved.
How Do You Report on Campaigns That Run Across Multiple Channels?
Report each channel in its own column instead of summing them together, since a click on a paid search platform and a click inside an email tool aren't measuring the same action. Normalize only at the outcome layer, meaning leads, pipeline, and revenue, where the definitions line up across channels.
How Long Should a Campaign Performance Report Be?
The summary should fit on a single screen, and every metric in it should connect back to the campaign's stated goal in one sentence. Supporting detail can live in an appendix that most readers will never open, because the appendix isn't where the decision gets made.
How Do You Measure the ROI of Organic Social in a Campaign Report?
Earned media value estimates what your organic impressions would have cost if you'd bought them as ads, using a set CPM per channel. It's an estimate, but it gives organic a dollar line that sits next to paid CPAs in the same report instead of getting stranded in an engagement section nobody weighs against spend.
Related Posts
Looking to learn more? The below posts may be helpful for you to learn more about social media and content marketing.